Doomism sure is bad. It’s even worse than us emitting the most co2 ever last year. Stay positive folks!
this post was submitted on 03 Mar 2025
65 points (94.5% liked)
Videos
14959 readers
769 users here now
For sharing interesting videos from around the Web!
Rules
- Videos only
- Follow the global Mastodon.World rules and the Lemmy.World TOS while posting and commenting.
- Don't be a jerk
- No advertising
- No political videos, post those to [email protected] instead.
- Avoid clickbait titles. (Tip: Use dearrow)
- Link directly to the video source and not for example an embedded video in an article or tracked sharing link.
- Duplicate posts may be removed
Note: bans may apply to both [email protected] and [email protected]
founded 2 years ago
MODERATORS
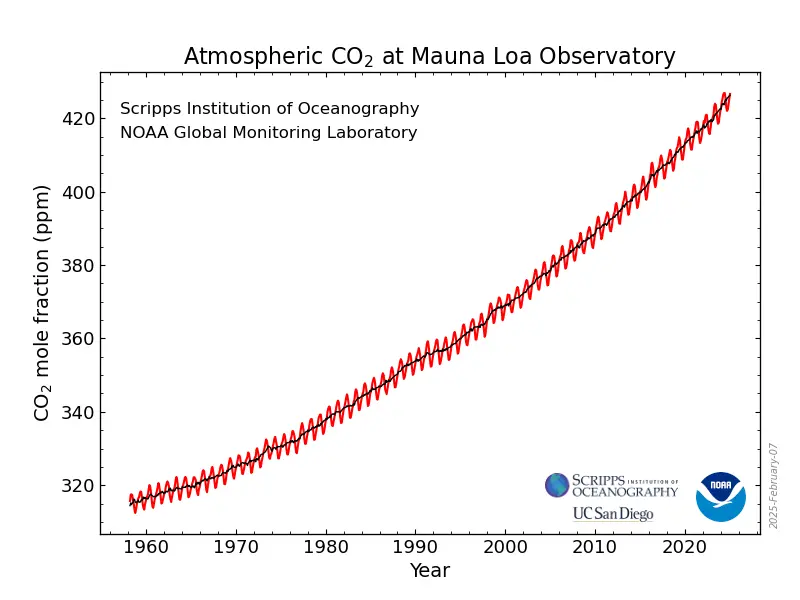
This is disingenuous. To lower atmospheric co2 we need to actively absorb co2 out from the atmosphere while the output of co2 is lower than the absorption. So to even see a progress on this chart we need to first achieve net zero.
I think I need to politely disagree with you on this point.
If co2 emissions were slowing at a meaningful rate, we should be able to see the upward trajectory start leveling off. What we DO see is almost no change in the trajectory of the chart, indicating that current carbon emitters haven't cut back enough to matter, if at all.
I'm not suggesting that no changes on that line means no "progress", but one could argue that its not meaningful progress if we aren't seeing any changes in that trend.
No, we would see an infection point on this chat if we were to make progress, even if we're not at net zero. The chart would at least be increasing at a decreasing rate, as opposed to the current trajectory increasing at a steady or even increasing rate.
Actually, since 2020 the curve looks linear rather than exponential, which does match what he says on the video that we might have stopped increasing emissions year over year. Obviously this is not enough, but it is progress.
Probably just due to covid lockdowns. Emissions have been steadily increasing since
https://www.statista.com/statistics/276629/global-co2-emissions/
So we'll have green energy but capitalism will be as strong as ever. A solar dystopia. At least there will be a future for us to be shadowrunners in.
Just watched this video myself last night. Really good. His other video on positive tipping points is worth a watch to.
Oh great, instead of +4C we're on track for +3.4C
Keep doing sarcasm like that and we will see +3.4°C turn into +3.8°C.
If we suddenly decide to stop spewing record amounts of greenhouse gases then we might have a small chance... But that needs to be a quick decline which we have simply not seen.