Data is Beautiful

5021 readers
4 users here now

A place to share and discuss visual representations of data: Graphs, charts, maps, etc.

DataIsBeautiful is for visualizations that effectively convey information. Aesthetics are an important part of information visualization, but pretty pictures are not the sole aim of this subreddit.

A place to share and discuss visual representations of data: Graphs, charts, maps, etc.

  A post must be (or contain) a qualifying data visualization.

  Directly link to the original source article of the visualization
    Original source article doesn't mean the original source image. Link to the full page of the source article as a link-type submission.
    If you made the visualization yourself, tag it as [OC]

  [OC] posts must state the data source(s) and tool(s) used in the first top-level comment on their submission.

  DO NOT claim "[OC]" for diagrams that are not yours.

  All diagrams must have at least one computer generated element.

  No reposts of popular posts within 1 month.

  Post titles must describe the data plainly without using sensationalized headlines. Clickbait posts will be removed.

  Posts involving American Politics, or contentious topics in American media, are permissible only on Thursdays (ET).

  Posts involving Personal Data are permissible only on Mondays (ET).

Please read through our FAQ if you are new to posting on DataIsBeautiful. Commenting Rules

Don't be intentionally rude, ever.

Comments should be constructive and related to the visual presented. Special attention is given to root-level comments.

Short comments and low effort replies are automatically removed.

Hate Speech and dogwhistling are not tolerated and will result in an immediate ban.

Personal attacks and rabble-rousing will be removed.

Moderators reserve discretion when issuing bans for inappropriate comments. Bans are also subject to you forfeiting all of your comments in this community.

Originally r/DataisBeautiful

founded 2 years ago
MODERATORS
76
 
 
77
20
[META] Looking for moderators. (self.dataisbeautiful)
submitted 1 year ago* (last edited 1 year ago) by WandererLagomorph770 to c/dataisbeautiful


Don't like making meta posts in image communities, but figured this one is important. I'm currently the only mod here and I've sadly had to be less active given sizable real life responsibilities. So posting here to see if anyone is up for assisting in mod management?

If anyone's interested just comment below and I can get things approved from there. Preferably say any experience you have if applicable.

78
 
 
79
7
submitted 1 year ago* (last edited 1 year ago) by Wilshire to c/dataisbeautiful


80
 
 
81


[OC] Hi ! I live near Lyon, France and this is a map from only my GPS traces from the last 4 years. #map @dataisbeautiful

82


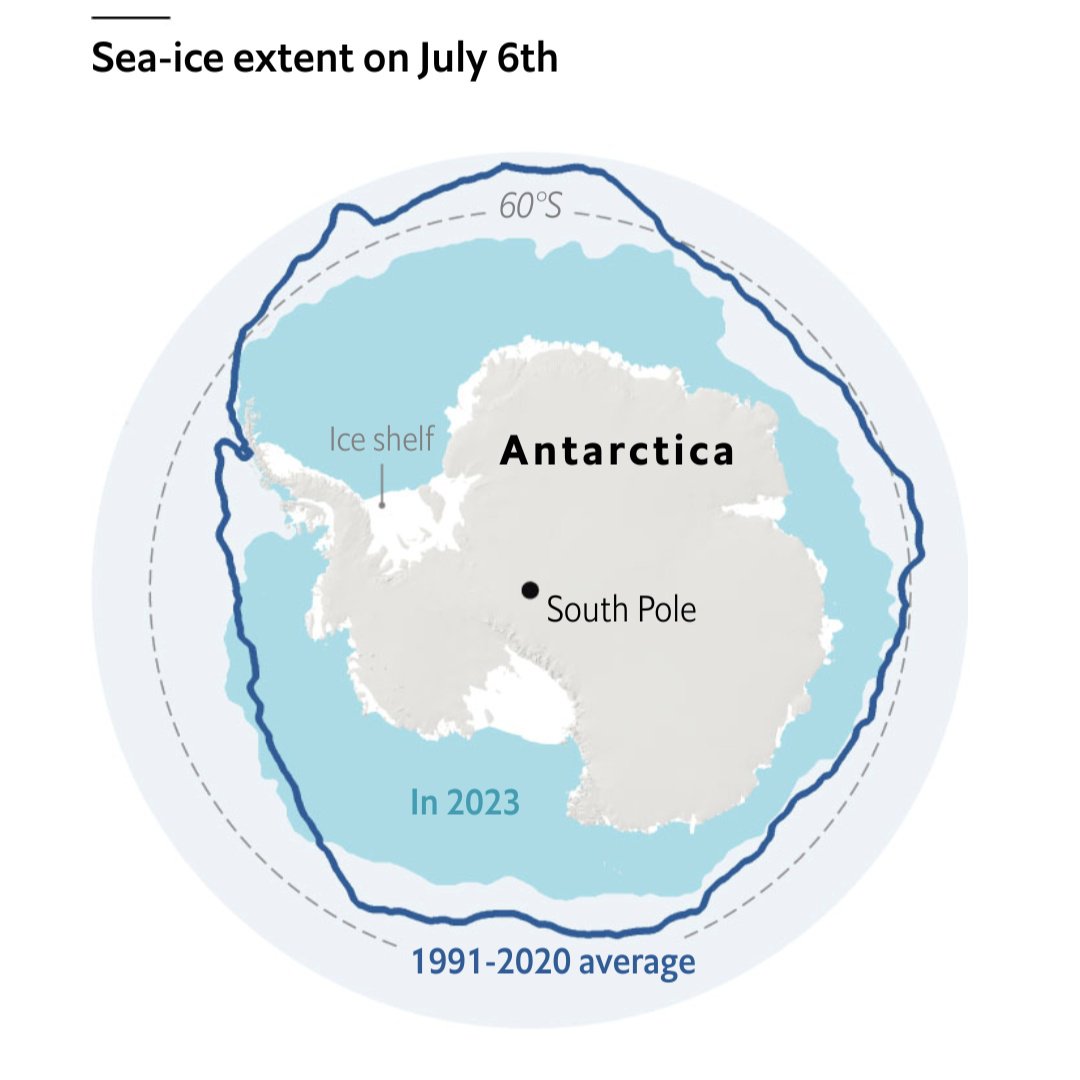
That 2023 line does not look ideal...

Source: The Economist

Each point represents a five day moving average. The x-axis is in terms of historical standard deviations, i.e each day is compared to the standard deviation of historical values for that year. So we are at -6 SD from the historical average for this point in time.

Other excellent visualizations are in the article!

83


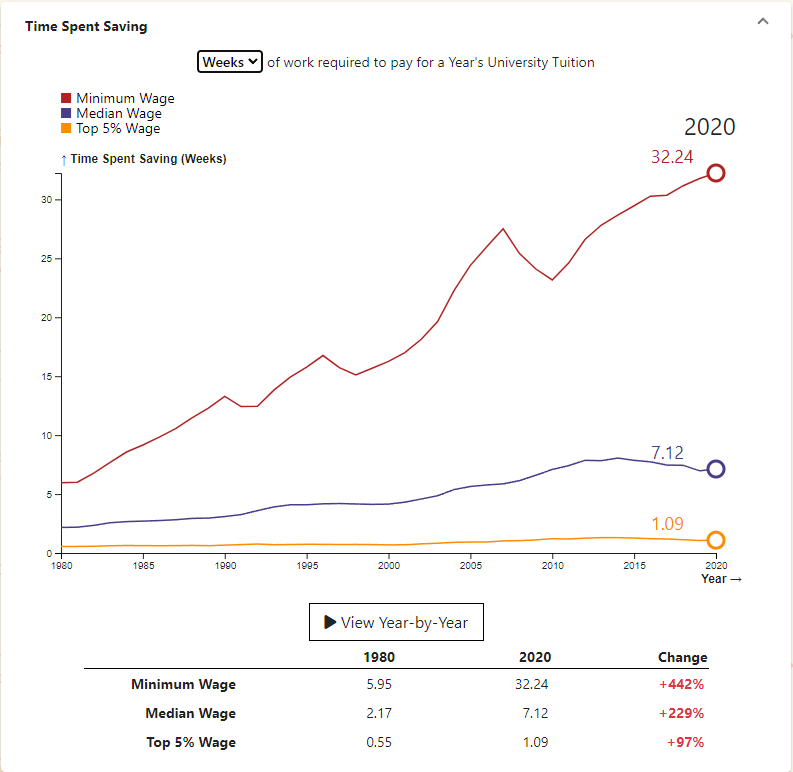
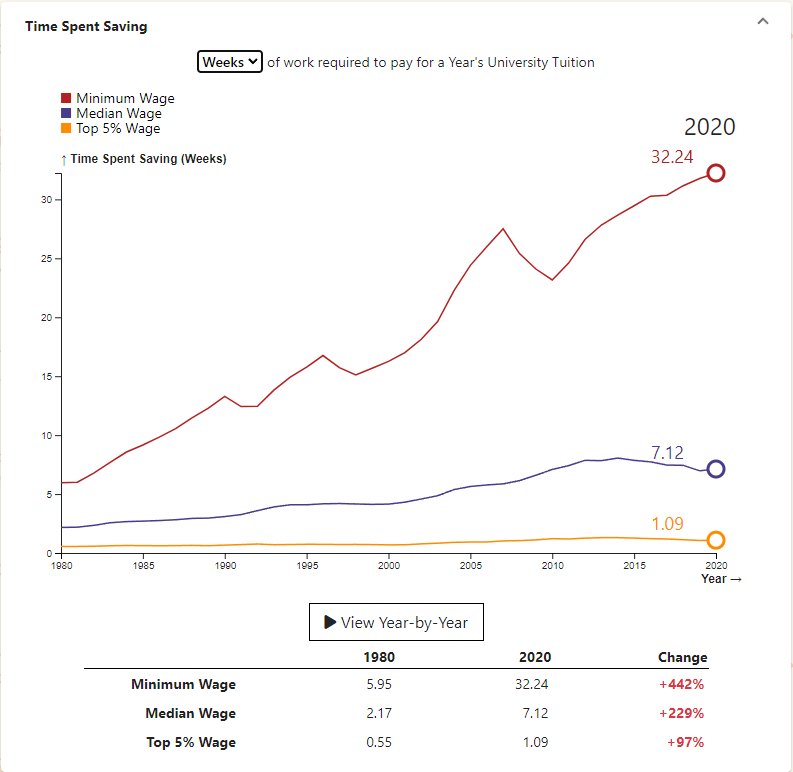
Workers have to work for a longer period of time in order to afford University Tuition than they used to in 1980. The trend is hardest on minimum wage workers who have to work 32.24 weeks of full-time work in 2020 to afford tuition, compared to 5.95 weeks of full-time work in 1980. This ignores taxes and assumes all money earned is put toward tuition.

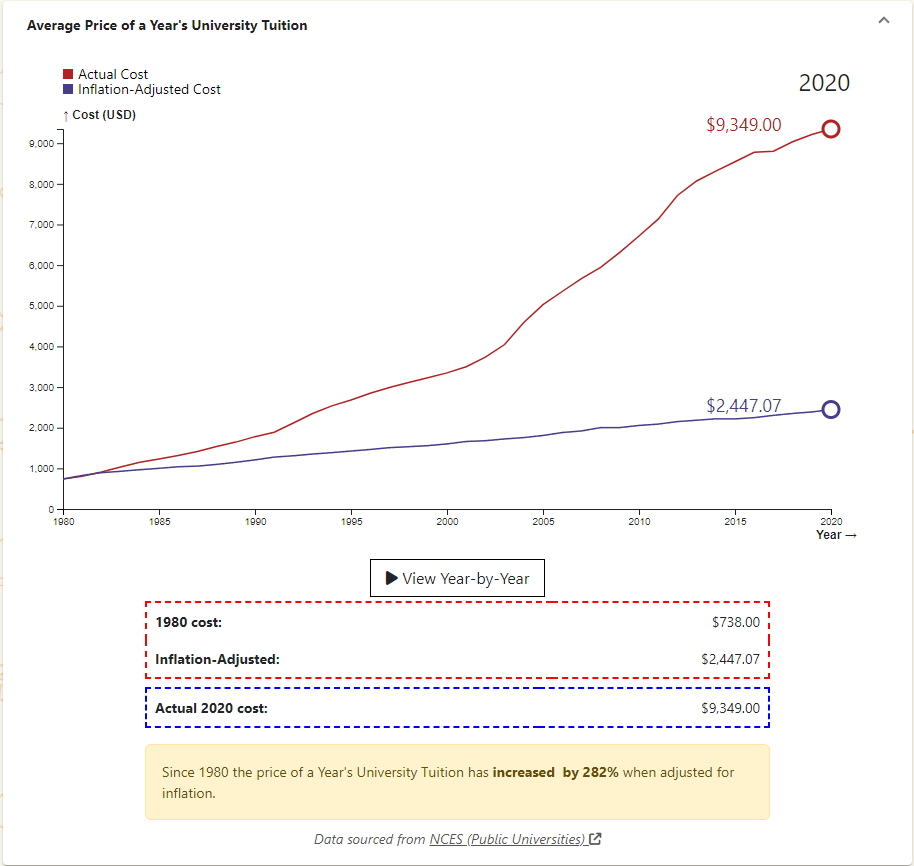
Since 1980 the price of a Year's University Tuition has increased by 282% when adjusted for inflation.

Wages have gone up nominally, but not as much when accounting for inflation. The minimum wage has decreased since 1980 after adjusting for inflation.

Sources:

Visualized on boomerchecker.com

Edit:

  • Fixed an error when converting Median and Top 5% from annual to weekly. The time to save for those two brackets rose as a result.
  • Added wage data for the different wage brackets for reference.
84


The animated gif shows how it changes throughout the seasons. Found in the Wikipedia article on athmospheric circulation.

85


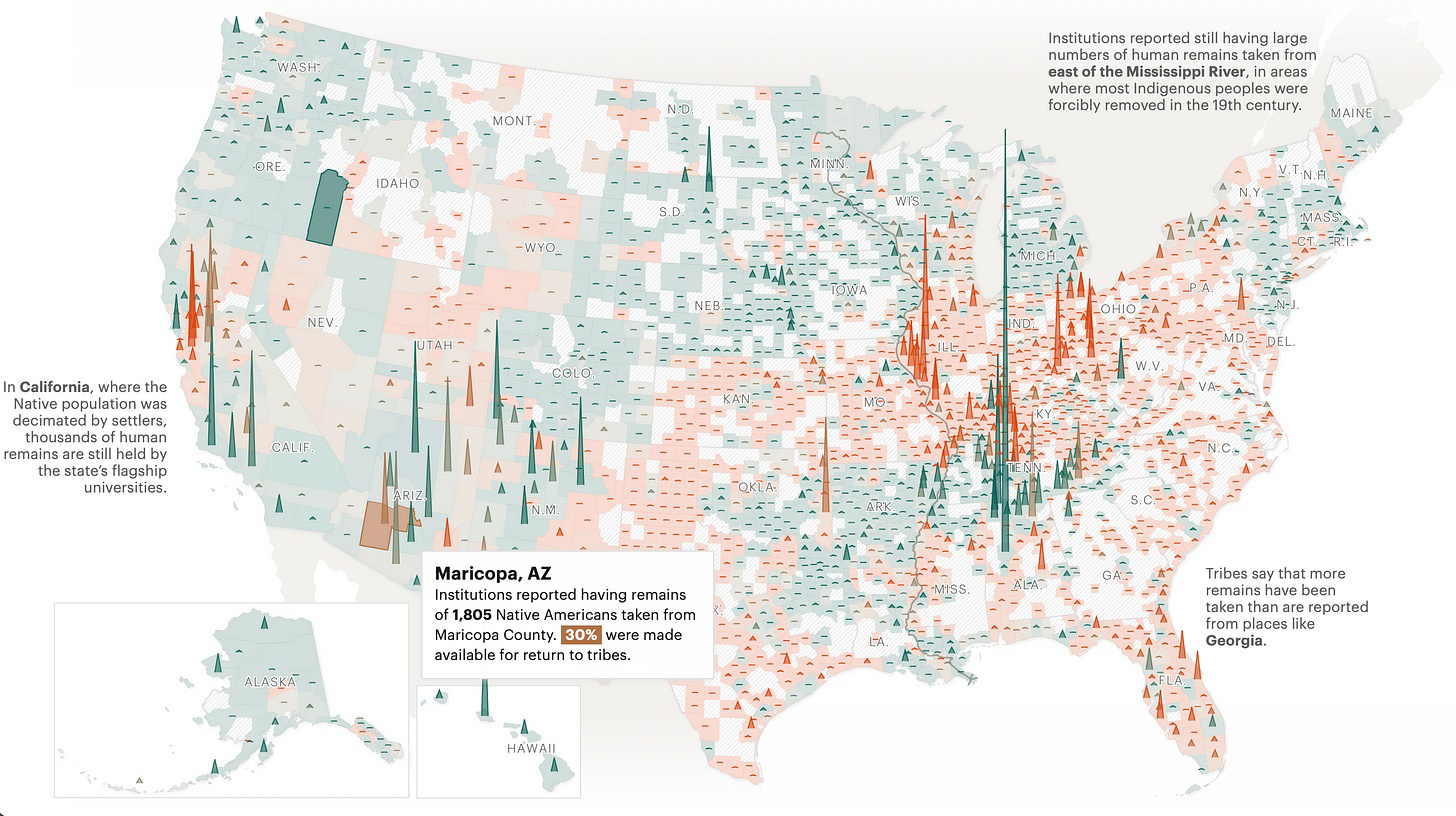
From Propublica: the Repatriation Project

In 1990, Congress passed a law recognizing the unequal treatment of Native American remains and set up a process for tribes to request their return from museums and other institutions that had them. The law, known as the Native American Graves Protection and Repatriation Act or NAGPRA, sought to address this human rights issue by giving Indigenous peoples a way to reclaim their dead.

But 33 years after the law’s passage, about half of the remains of more than 210,000 Native Americans have yet to be returned. Tribes have struggled to reclaim them in part because of a lack of federal funding for repatriation and because institutions face little to no consequences for violating the law or dragging their feet.

This database allows you to search for information on the roughly 600 federally funded institutions that reported having such remains to the Department of the Interior. While the data is self-reported, it is a starting point for understanding the damage done by generations of Americans who stole, collected and displayed the remains and possessions of the continent’s Indigenous peoples — and the work done by tribes and institutions to repatriate those Native ancestors since.

86
 
 
87


cross-posted from: https://lemmy.world/post/1192921

Lemmy just reached a new milestone: 1 million posts, across 1,323 servers.

Source: https://lemmy.fediverse.observer/dailystats&days=90

88


cross-posted from: https://lemmy.world/post/1094374

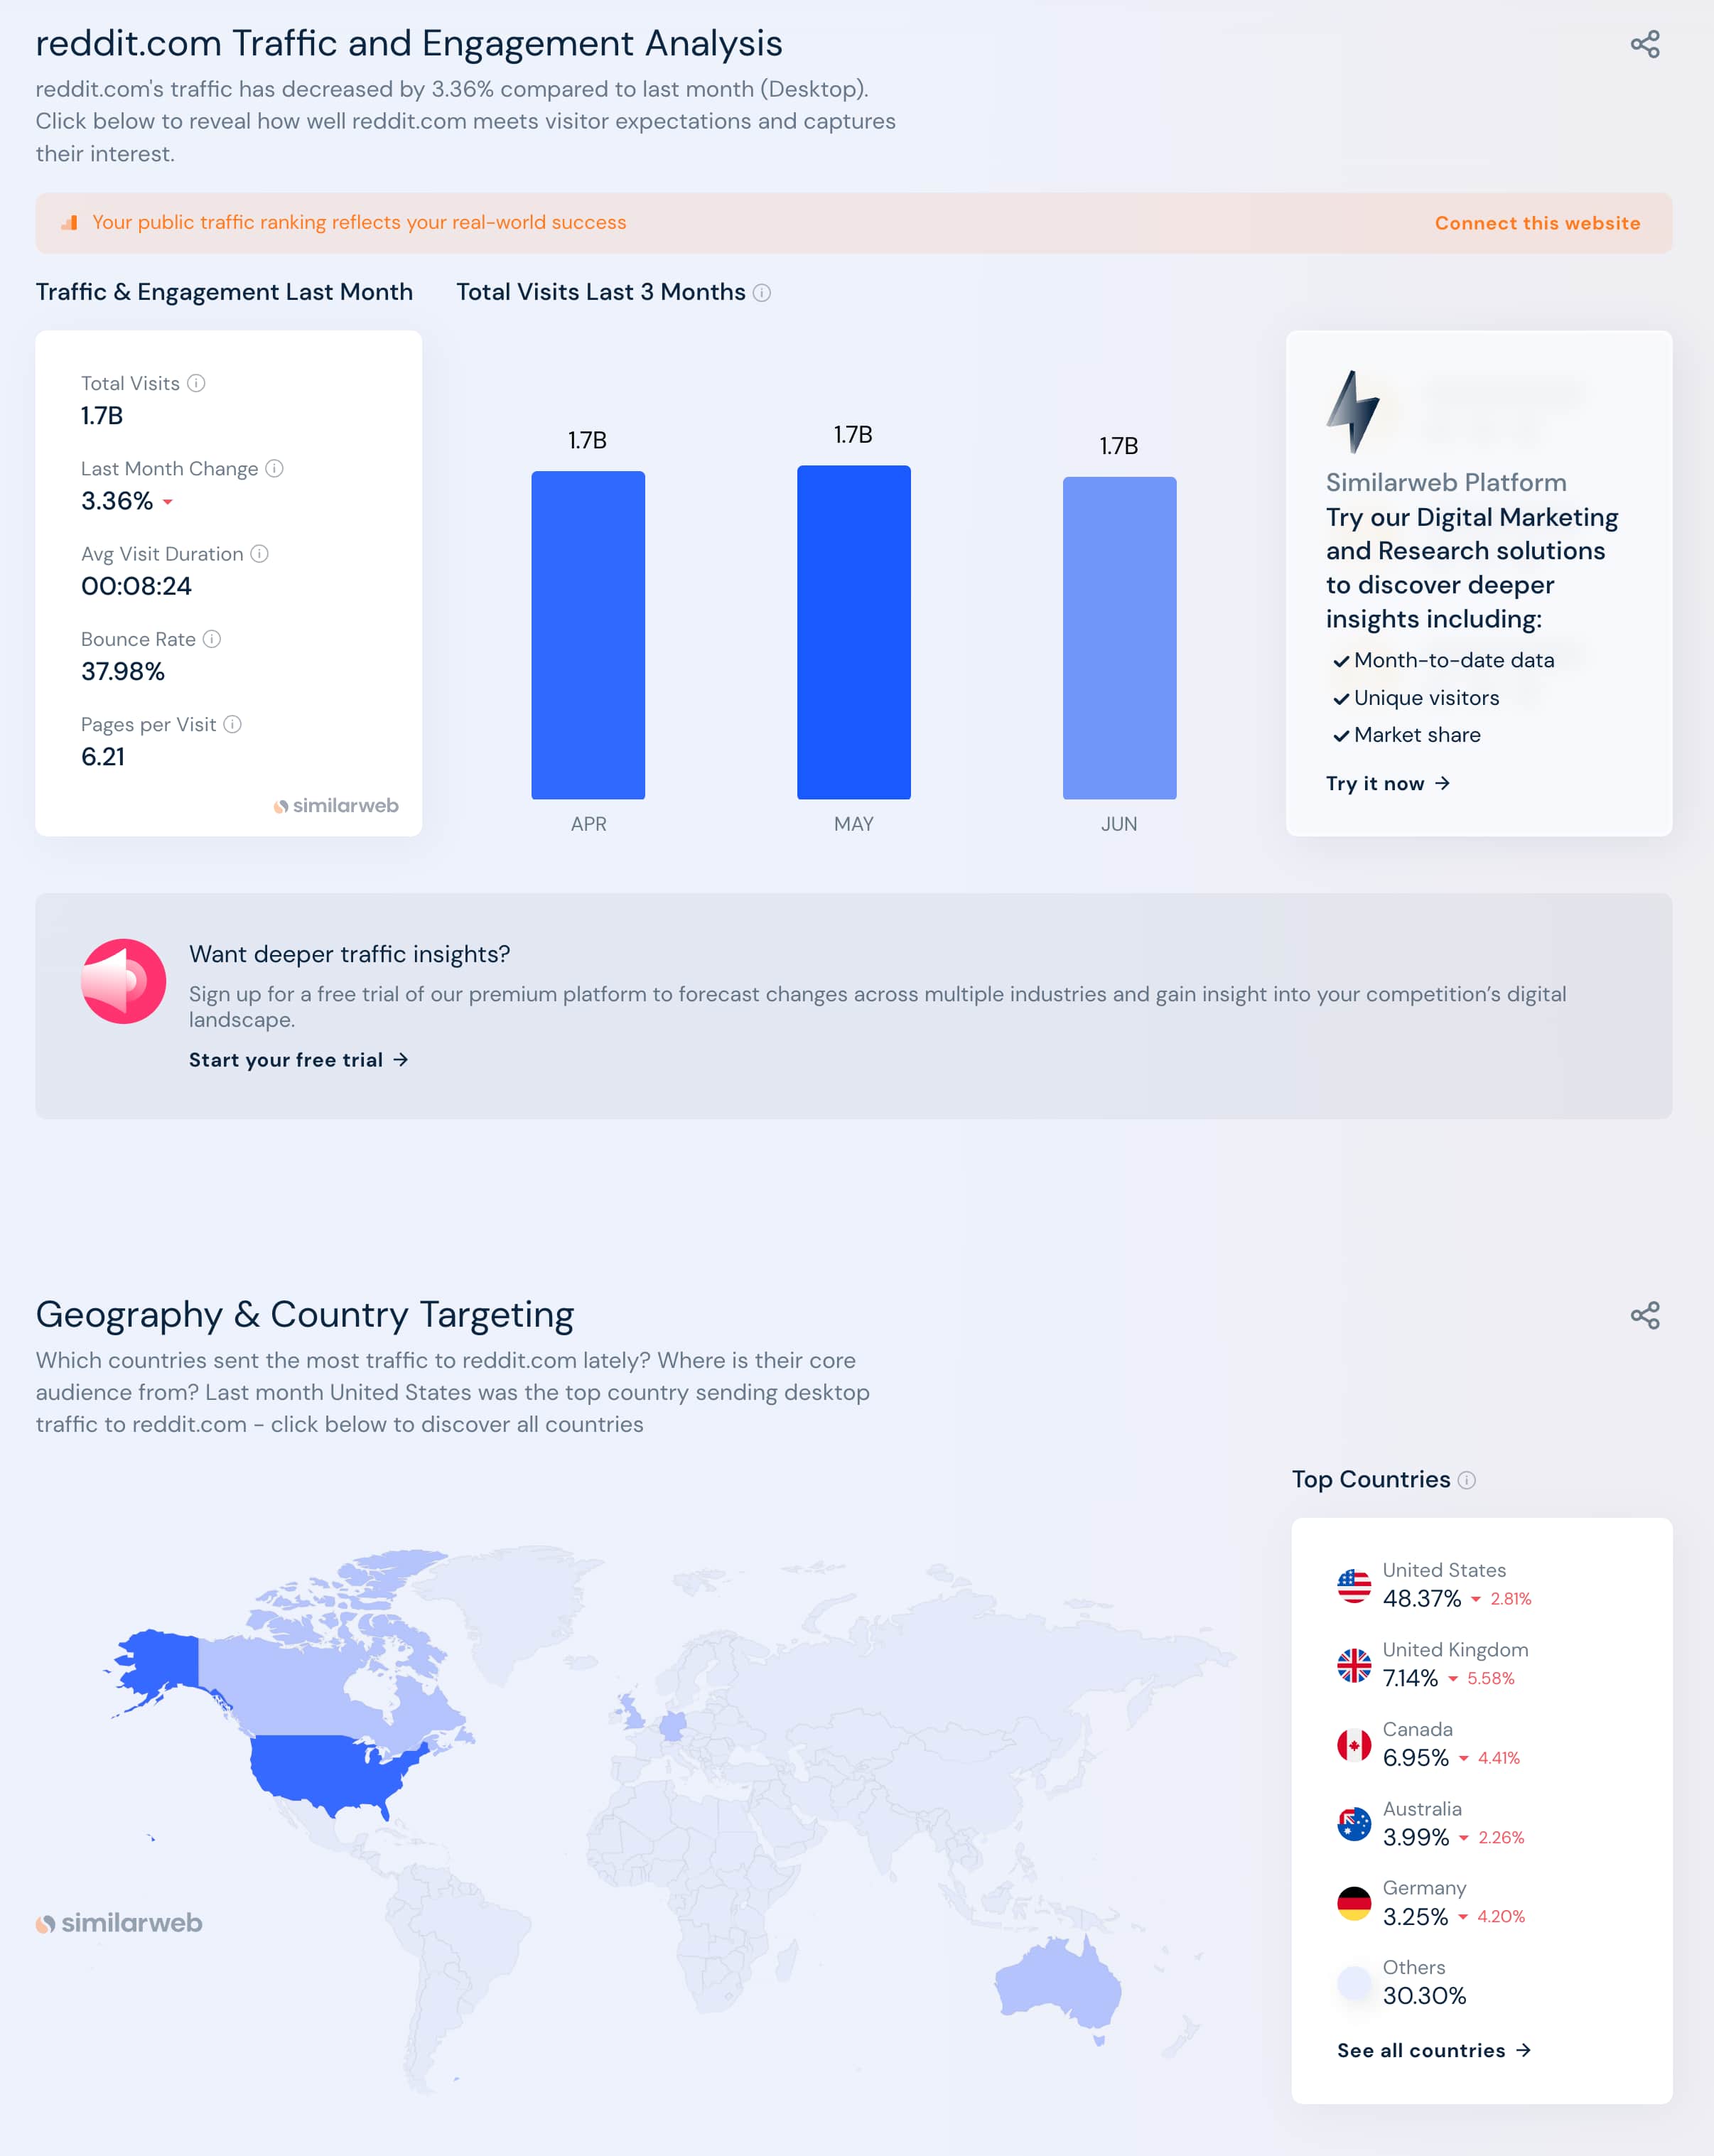
SimilarWeb has just released traffic estimates for June. According to these estimates, Reddit's traffic has seen a 3.36% month-over-month decrease.

For comparison, here's how traffic has changed for other popular social networking websites:

  • Discord.com: +0.51%
  • Twitter.com: -1.65%
  • Instagram.com: -1.35%
  • Facebook.com: -3.18%
  • TikTok.com: +0.77%
  • Pinterest.com: -2.27%
  • Youtube.com: -2.02%

Source: https://www.similarweb.com/website/reddit.com/#overview

89
90
12
Our world in data (ourworldindata.org)
submitted 1 year ago by X0X0 to c/dataisbeautiful


For those addicted to data and graphs, this is a good source

91
163
submitted 1 year ago* (last edited 1 year ago) by JanoRis to c/dataisbeautiful


During the Reddit Blackout i made a graph showing the posts and comments/day (Link).

Some days ago i was asked to make an Update so here it is.

Source Data is from here and contains the same Data as some may know from here. Only difference is that the post and comment count is summed over the day.

EDIT:

The Original Post Data contained inconsistent Data points on each day (see here).

This is the corrected Chart, which uses the difference in Post IDs between the days to calculate the daily number (adjusted to s between the api calls):

I also adjusted the values to 10^6 and adjusted the y-axis ranges, I hope this makes it easier on the eyes.

For people complaining on the mixed chart: Double column looks bad with 2Y-Axis, and double lines looks too empty. 2Y-Axis are necessary cause of the difference in scaling of the posts and comments data, only other option would be an axis break.