this post was submitted on 01 Jun 2024
93 points (97.9% liked)

Climate - truthful information about climate, related activism and politics.

4678 readers
905 users here now

Discussion of climate, how it is changing, activism around that, the politics, and the energy systems change we need in order to stabilize things.

As a starting point, the burning of fossil fuels, and to a lesser extent deforestation and release of methane are responsible for the warming in recent decades: Graph of temperature as observed with significant warming, and simulated without added greenhouse gases and other anthropogentic changes, which shows no significant warming

How much each change to the atmosphere has warmed the world: IPCC AR6 Figure 2 - Thee bar charts: first chart: how much each gas has warmed the world.  About 1C of total warming.  Second chart:  about 1.5C of total warming from well-mixed greenhouse gases, offset by 0.4C of cooling from aerosols and negligible influence from changes to solar output, volcanoes, and internal variability.  Third chart: about 1.25C of warming from CO2, 0.5C from methane, and a bunch more in small quantities from other gases.  About 0.5C of cooling with large error bars from SO2.

Recommended actions to cut greenhouse gas emissions in the near future:

Anti-science, inactivism, and unsupported conspiracy theories are not ok here.

founded 1 year ago
MODERATORS
93
submitted 1 month ago* (last edited 1 month ago) by [email protected] to c/[email protected]
 

I wanted to share a small project I've been working on. The goal was to make the data from NASA's Landsat Thermal Infrared Sensor more accessible to the general public.

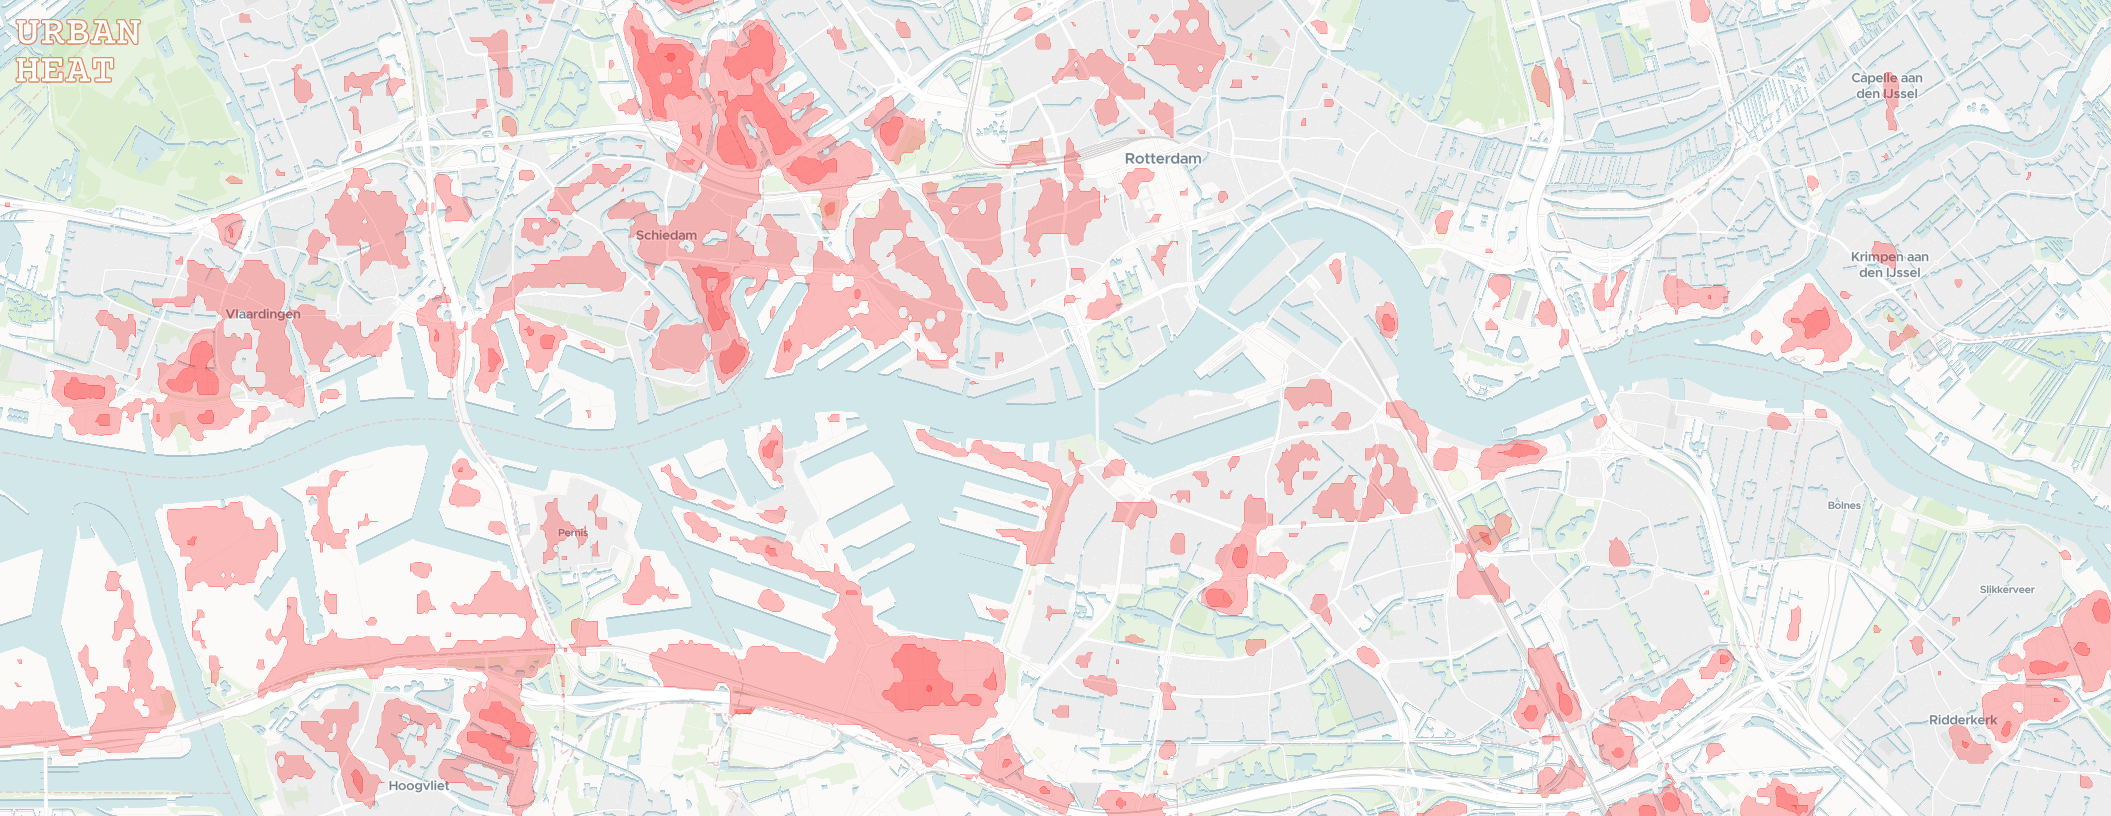
I worked with the raw temperature band data to general annual maximum surface temperature raster images for large urban areas covered by the Eurostat GISCO Urban Audit. In the browser, these images are transformed into easier to interpret isotherm contours with some adjustable settings.

I don't have a specific target audience in mind. The map could help identify areas of refuge for the warmer months, or overheated neighborhoods to avoid as we march towards a toasty future.

Feedback is welcome :)


EDIT: For UK visitors, sorry to leave you with an empty map...

I've taken a look at older urban extent data and found the geometry I need to process the UK (from before leaving Eurostat). However, there are still some UI limitations to overcome since it seems that cities are split into many boroughs that could only be viewed one at a time. The reason I went with the Eurostat dataset to begin with was a nice delineation of what a city was (for the purposes of this project).

Don't have a timeline, but I do want to add the UK and automatic loading of cities as you pan!

top 12 comments
sorted by: hot top controversial new old
[–] [email protected] 7 points 1 month ago* (last edited 1 month ago) (2 children)

Is there a bug? When I click it takes me to some random city with heat data, but panning/zooming any other city is just grey.

Makes me think you have coverage on many cities but the AJAX call to get new data isn’t working.

[–] [email protected] 10 points 1 month ago

Sorry, you currently need to click to load another area. You can also navigate with the search bar or randomize by clicking the city icon.

I do want to load things automatically but need to figure out how to avoid hogging to much resources for contouring on the users device.

This is the first time sharing this, so a bit of an early release 😅

[–] [email protected] 3 points 1 month ago (1 children)

Works for me, but you have to tap on the city you want to see for the data to be displayed

[–] [email protected] 7 points 1 month ago

It’s admittedly less obvious on mobile.

[–] hitwright 6 points 1 month ago

This is awesome! Thank you for sharing!

[–] [email protected] 5 points 1 month ago (1 children)

Interesting project!

Seems to be giving an error on both Firefox mobile and desktop, but I was able to use it on Chrome.

Firefox error page:

[–] [email protected] 4 points 1 month ago* (last edited 1 month ago) (1 children)

Do you mind sharing the OS? This was developed on Firefox (Debian & iOS).

I don’t know if your WebGL is working correctly but I could try to add a check (and thus a more graceful failure mode).

Thank you for the report!

[–] [email protected] 2 points 4 weeks ago* (last edited 4 weeks ago)

The errors occurred on standard Firefox running on Windows 10 LTSC, and for mobile on Graphene OS using mull, a hardened version of Firefox mobile.

Both were using ublock origin and localCDN extensions.

[–] vaquedoso 2 points 1 month ago (1 children)
[–] [email protected] 1 points 1 month ago

If you’re willing to share OS/browser that could help :)

I’m on the fence with adding Sentry as I was hoping to keep the project very privacy minded.

[–] [email protected] 1 points 1 month ago (1 children)

Are only some cities available? I don't see US cities or Singapore with data.

Love the project, great visualization

[–] [email protected] 3 points 1 month ago

Yes, only European cities covered by Eurostat. I tried to cover this in the about section but it basically boils down to processing time, my own available time and to a lesser extent storage.

It took me more than a week to process 2013-2023 for the included areas, which is roughly 10TB of raw imagery (with less than 60% cloud cover).

The Eurostat urban extents, for the most part, delineate urban areas with a detailed vector dataset. This is something that I also couldn’t find on a global scale.

I’m not decided yet on expanding the extents, which also depends on if people actually find this useful. However, it is open source (AGPL) so it can easily be forked and adapted.