Cruise operating expense is part of total operating expense. Total = cruise + sell & admin + depreciation And yes, in data slides, you may find bar graph in last slides
link to data slides slides
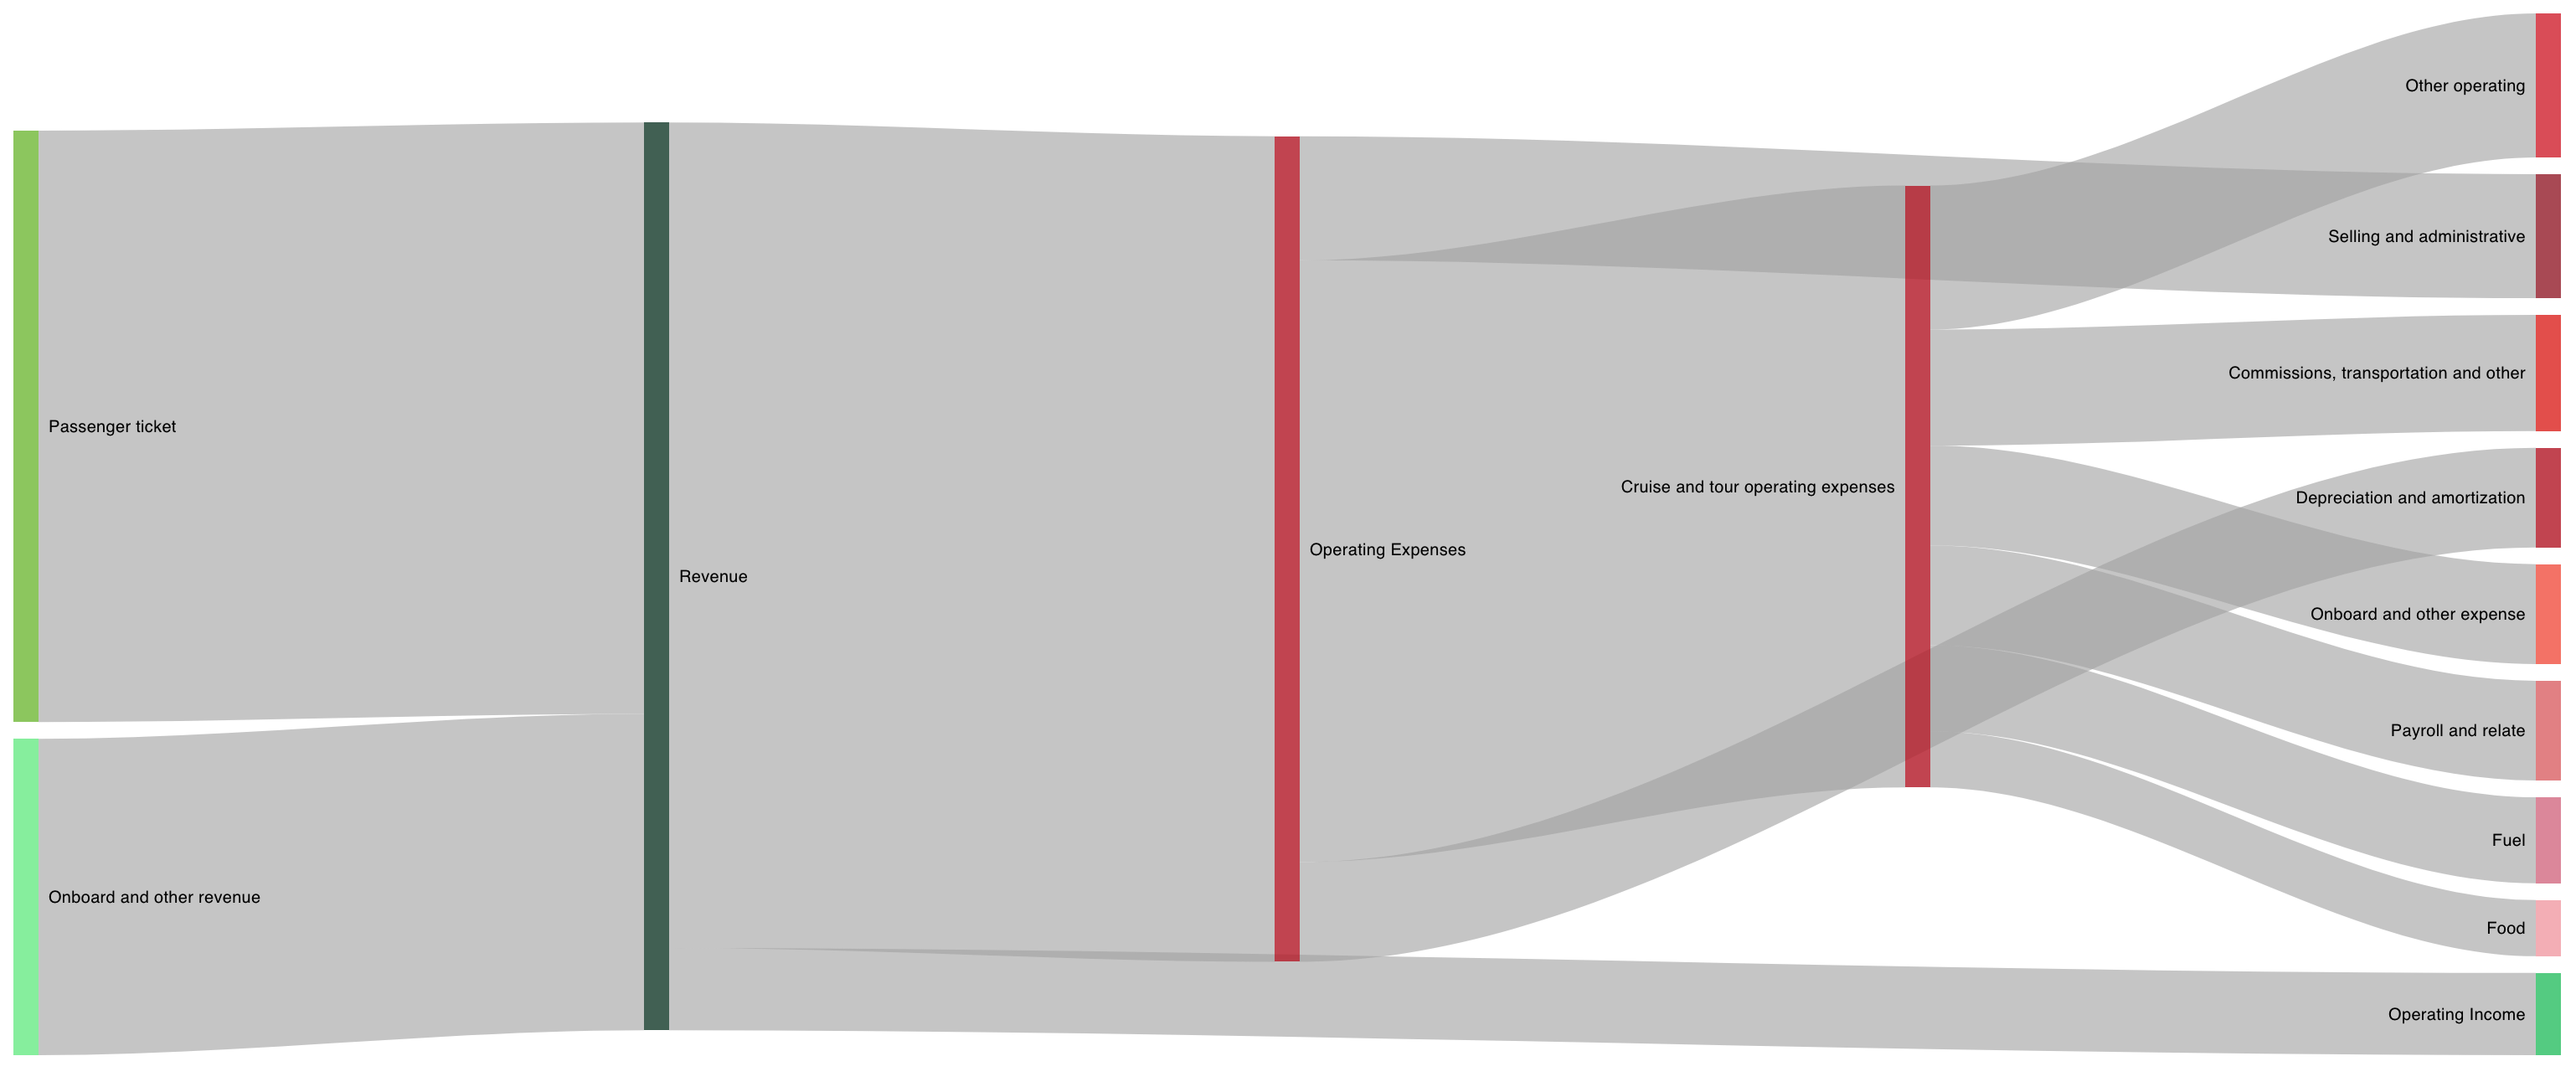
- Carnival income statement (in millions) - image attached
- Royal Caribbean
- Norwegian
- Compare cruises and tour operating expenses among three ^^
link to data slides
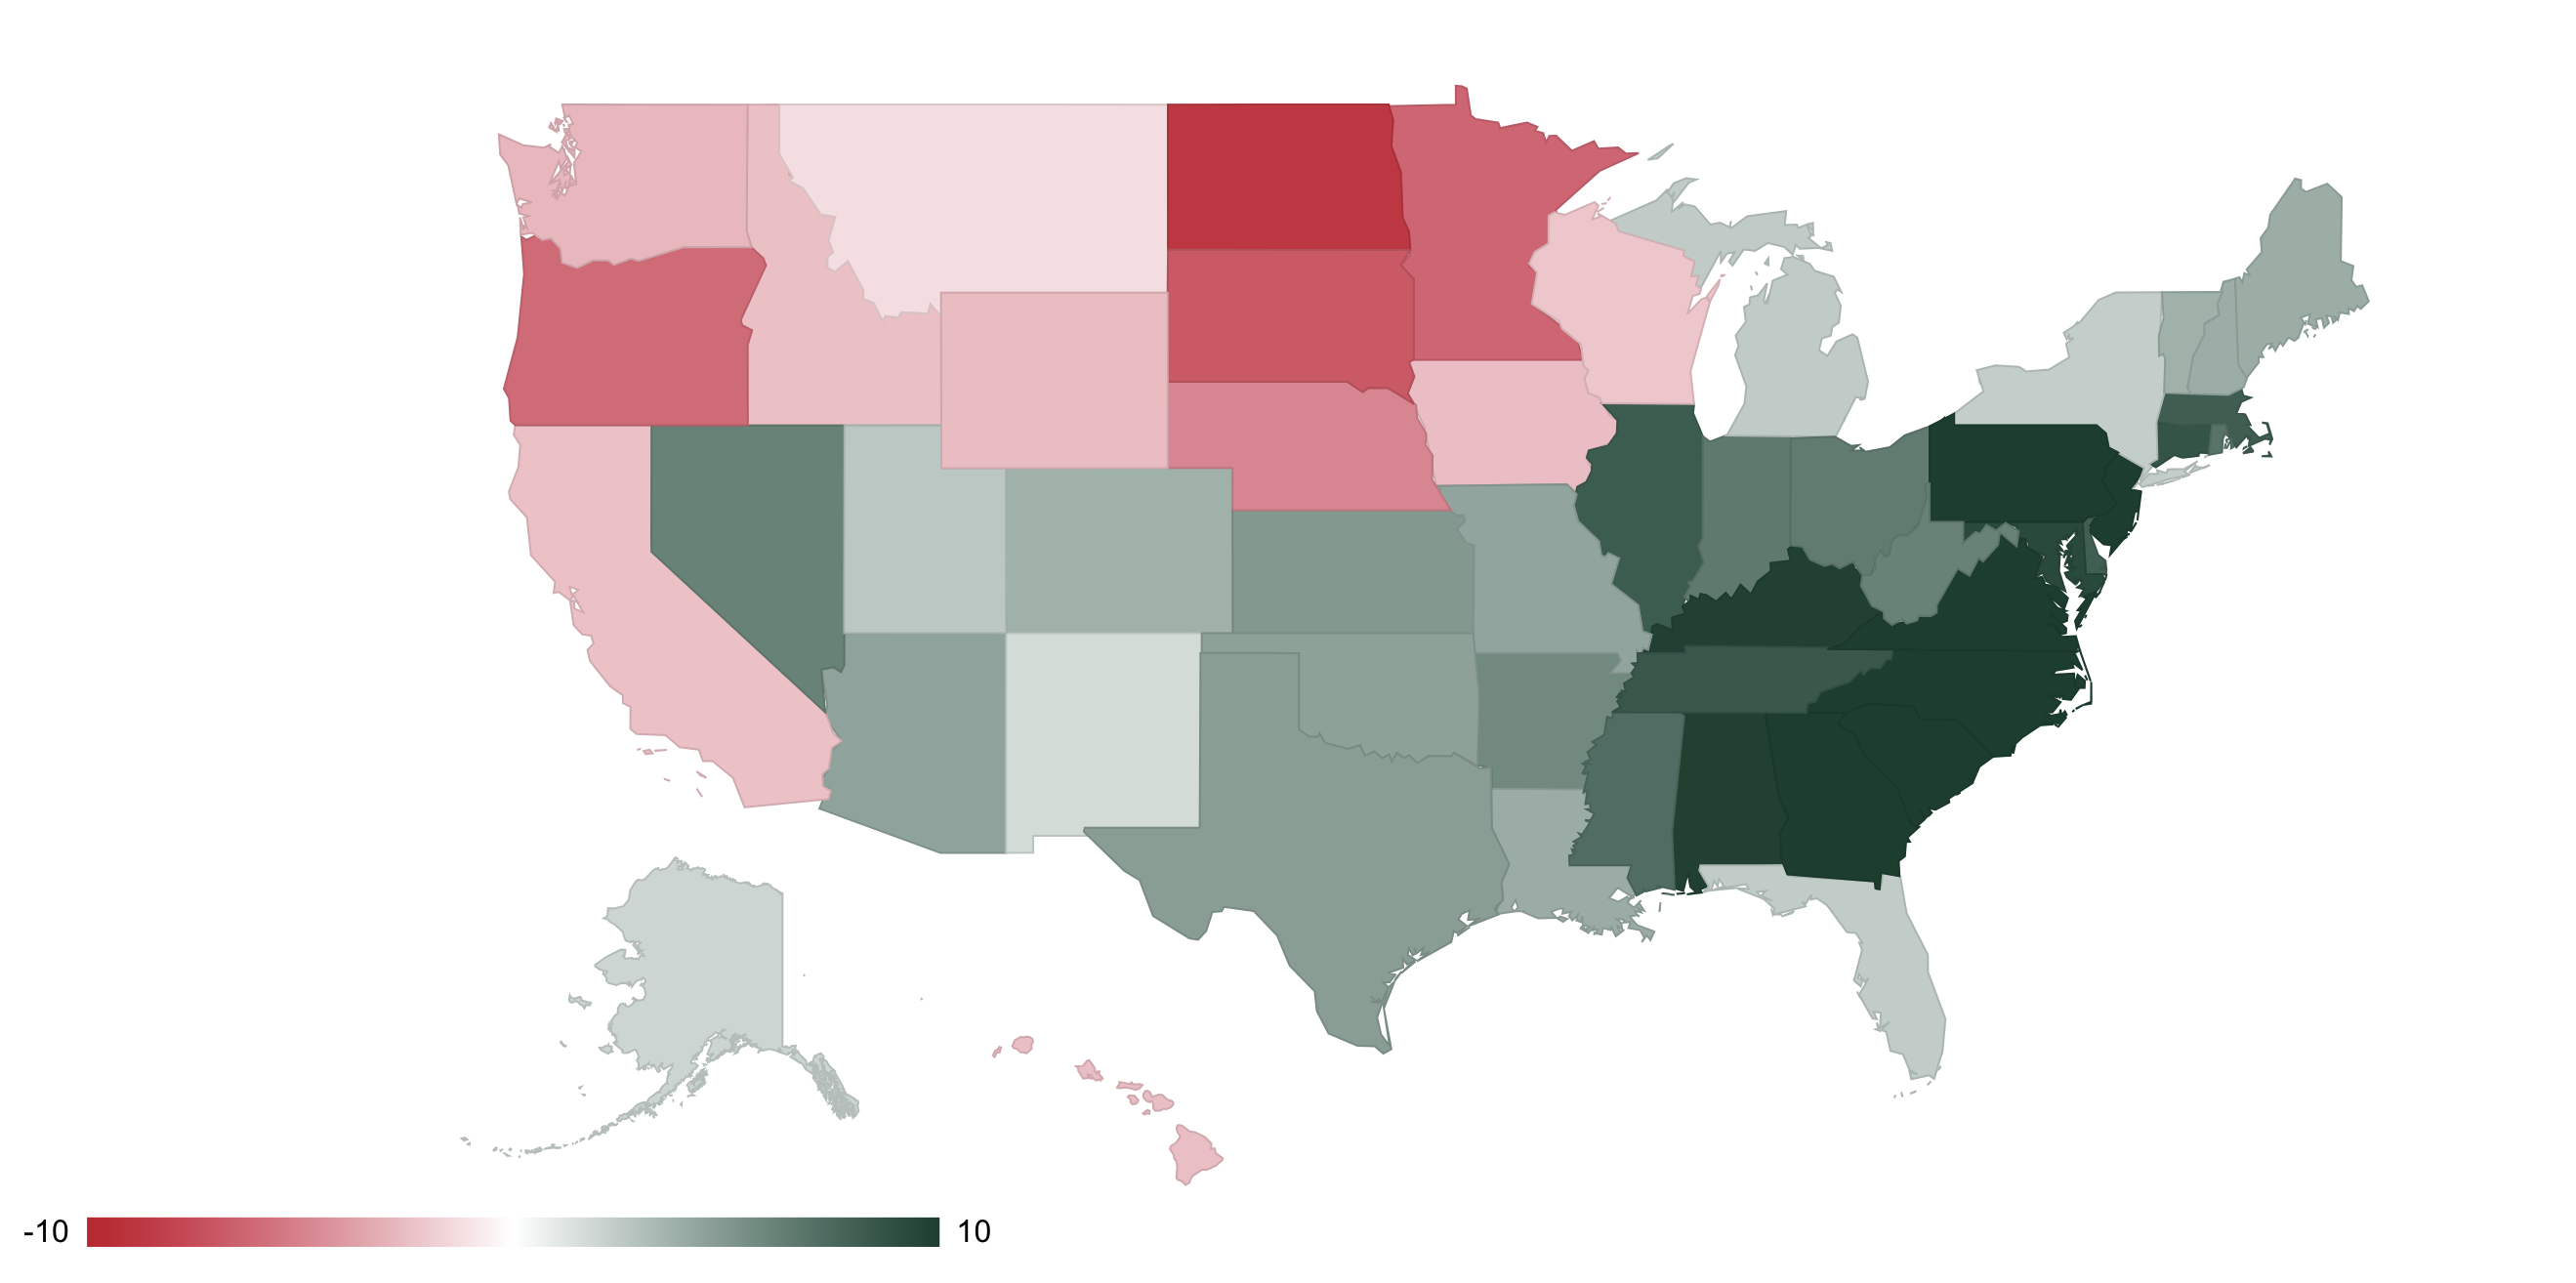
- First half residential sales percentage change x% yoy (2023 vs 2024) - image attached
- commercial sales percentage change yoy
- industrial sales percentage change yoy
- Top 10 states by total electricity sales
link to data slides
Count all UCLA + UCB
link to data slides
Slides:
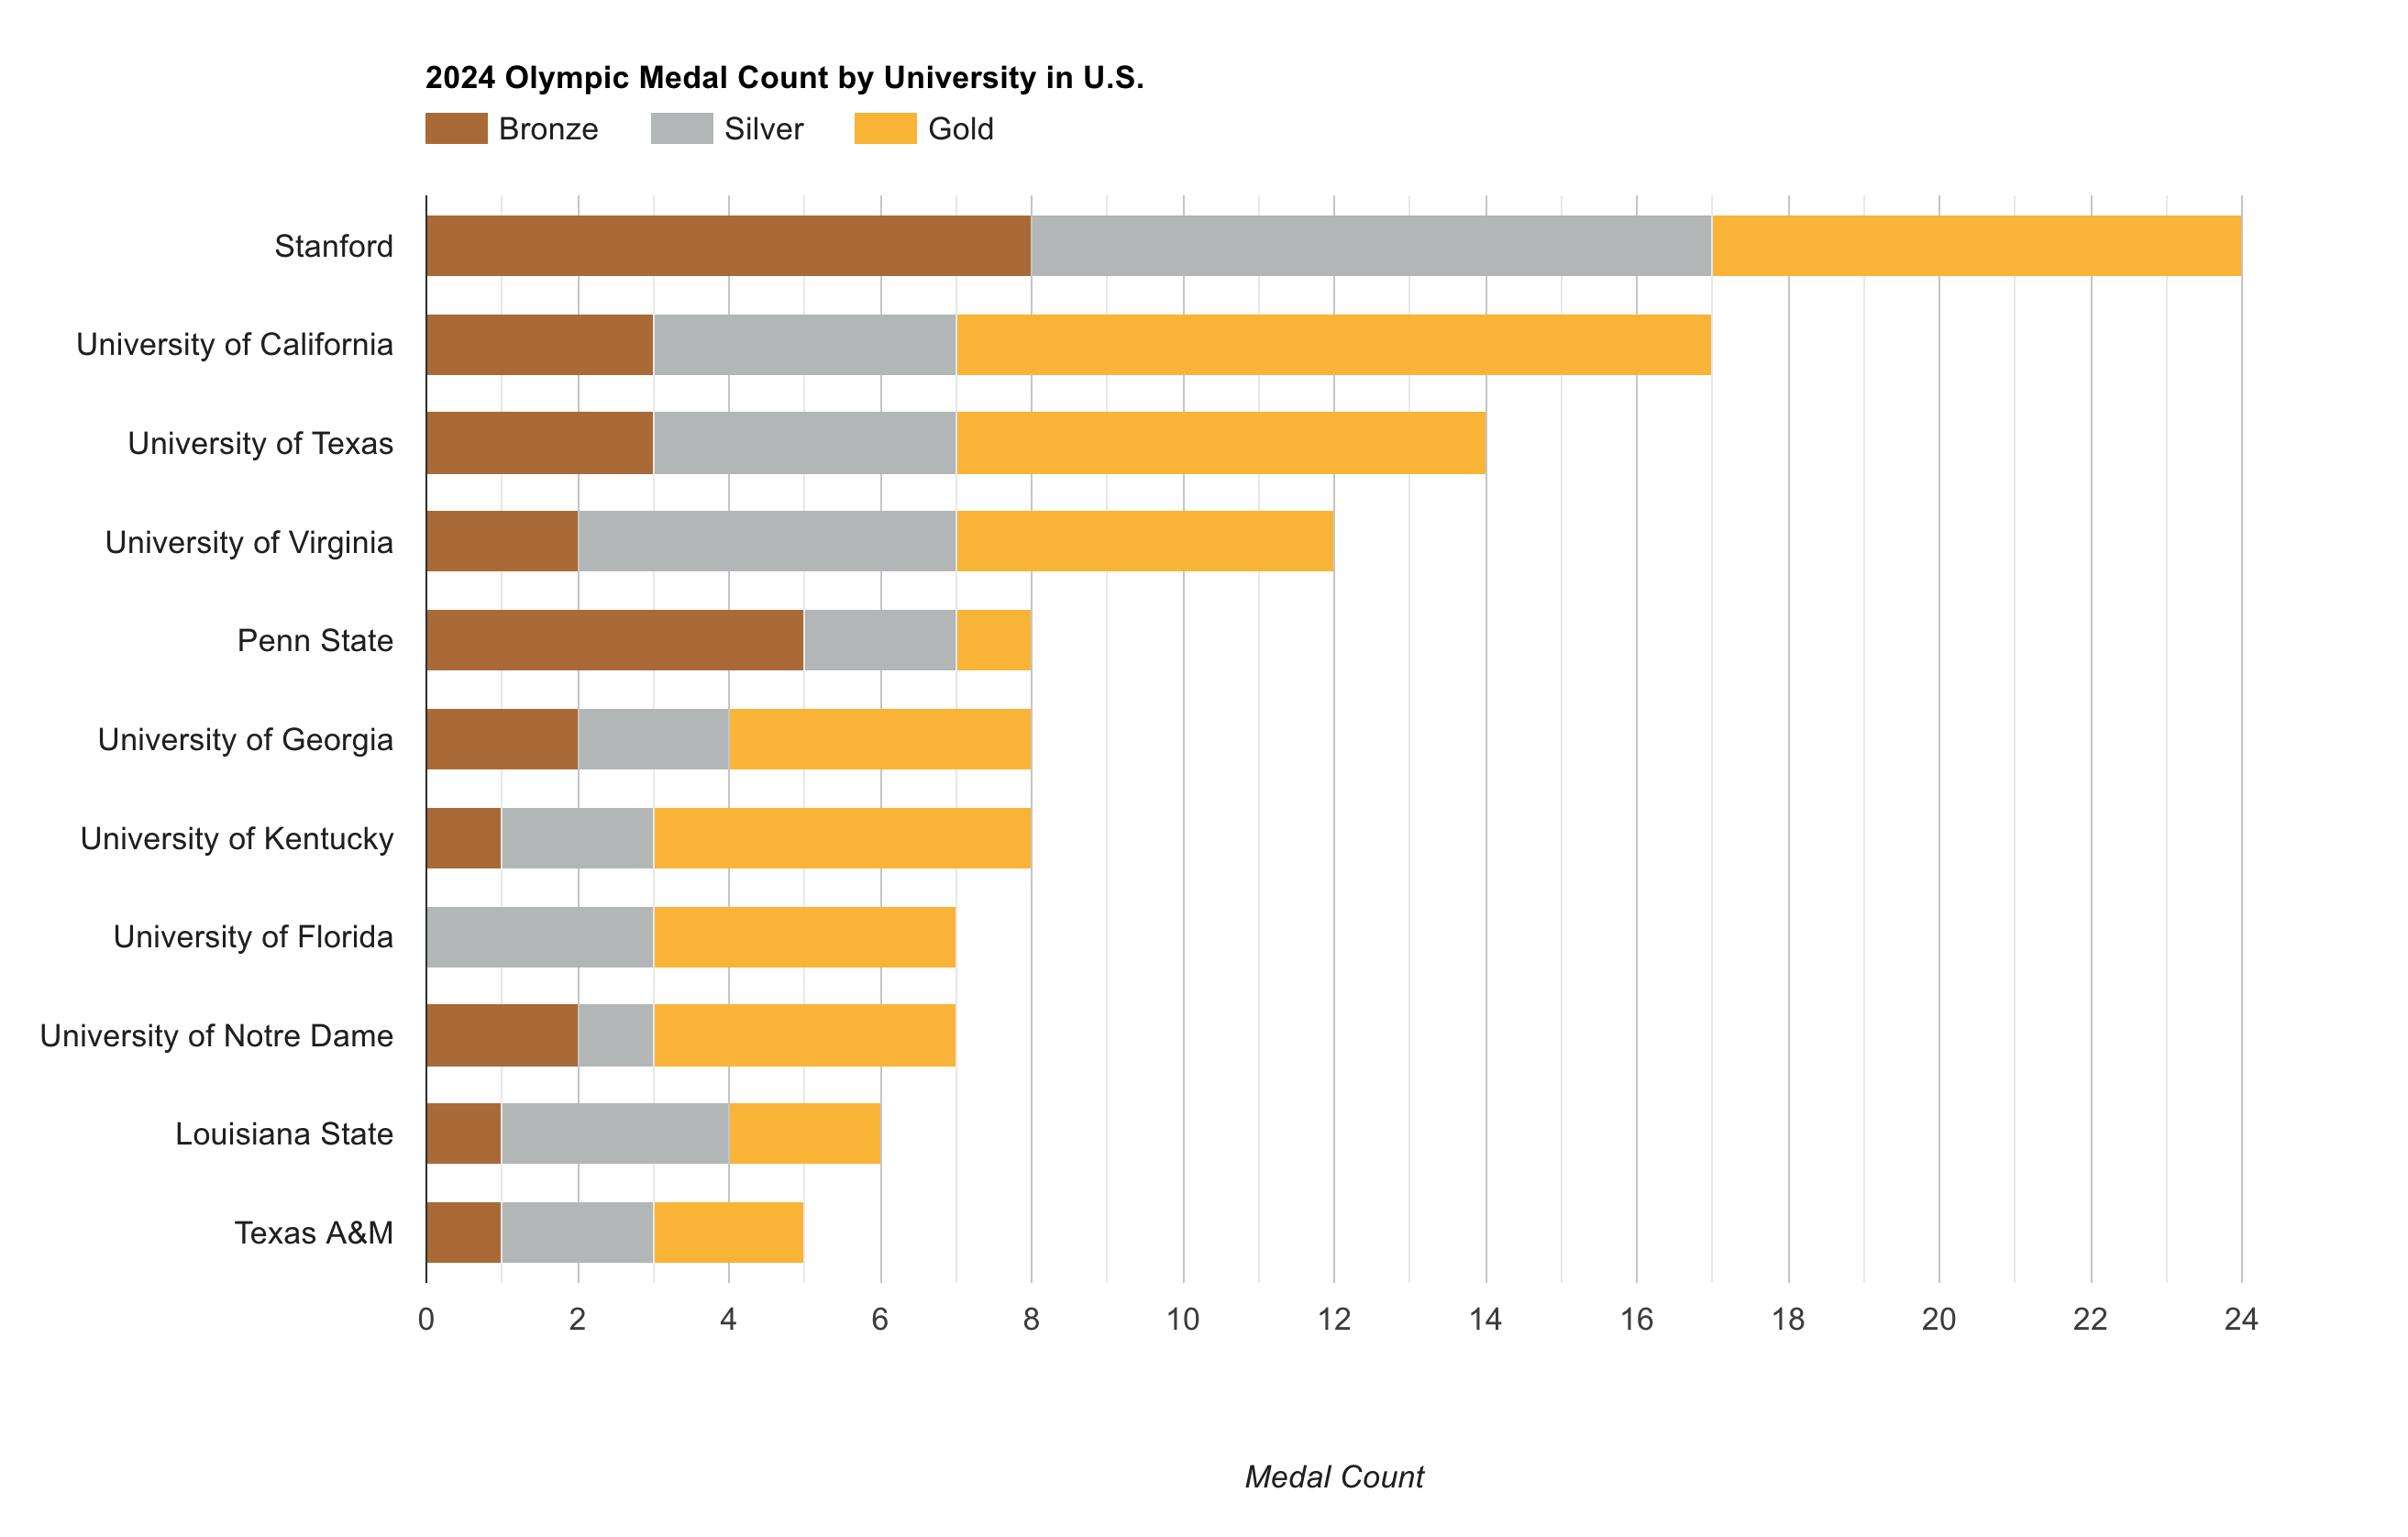
- U.S. medalists by sports & college admission, top 10
- Rank of college by medals per sports event, top 10 (image attached)
- Home state distribution of U.S. medalists
link to data slides
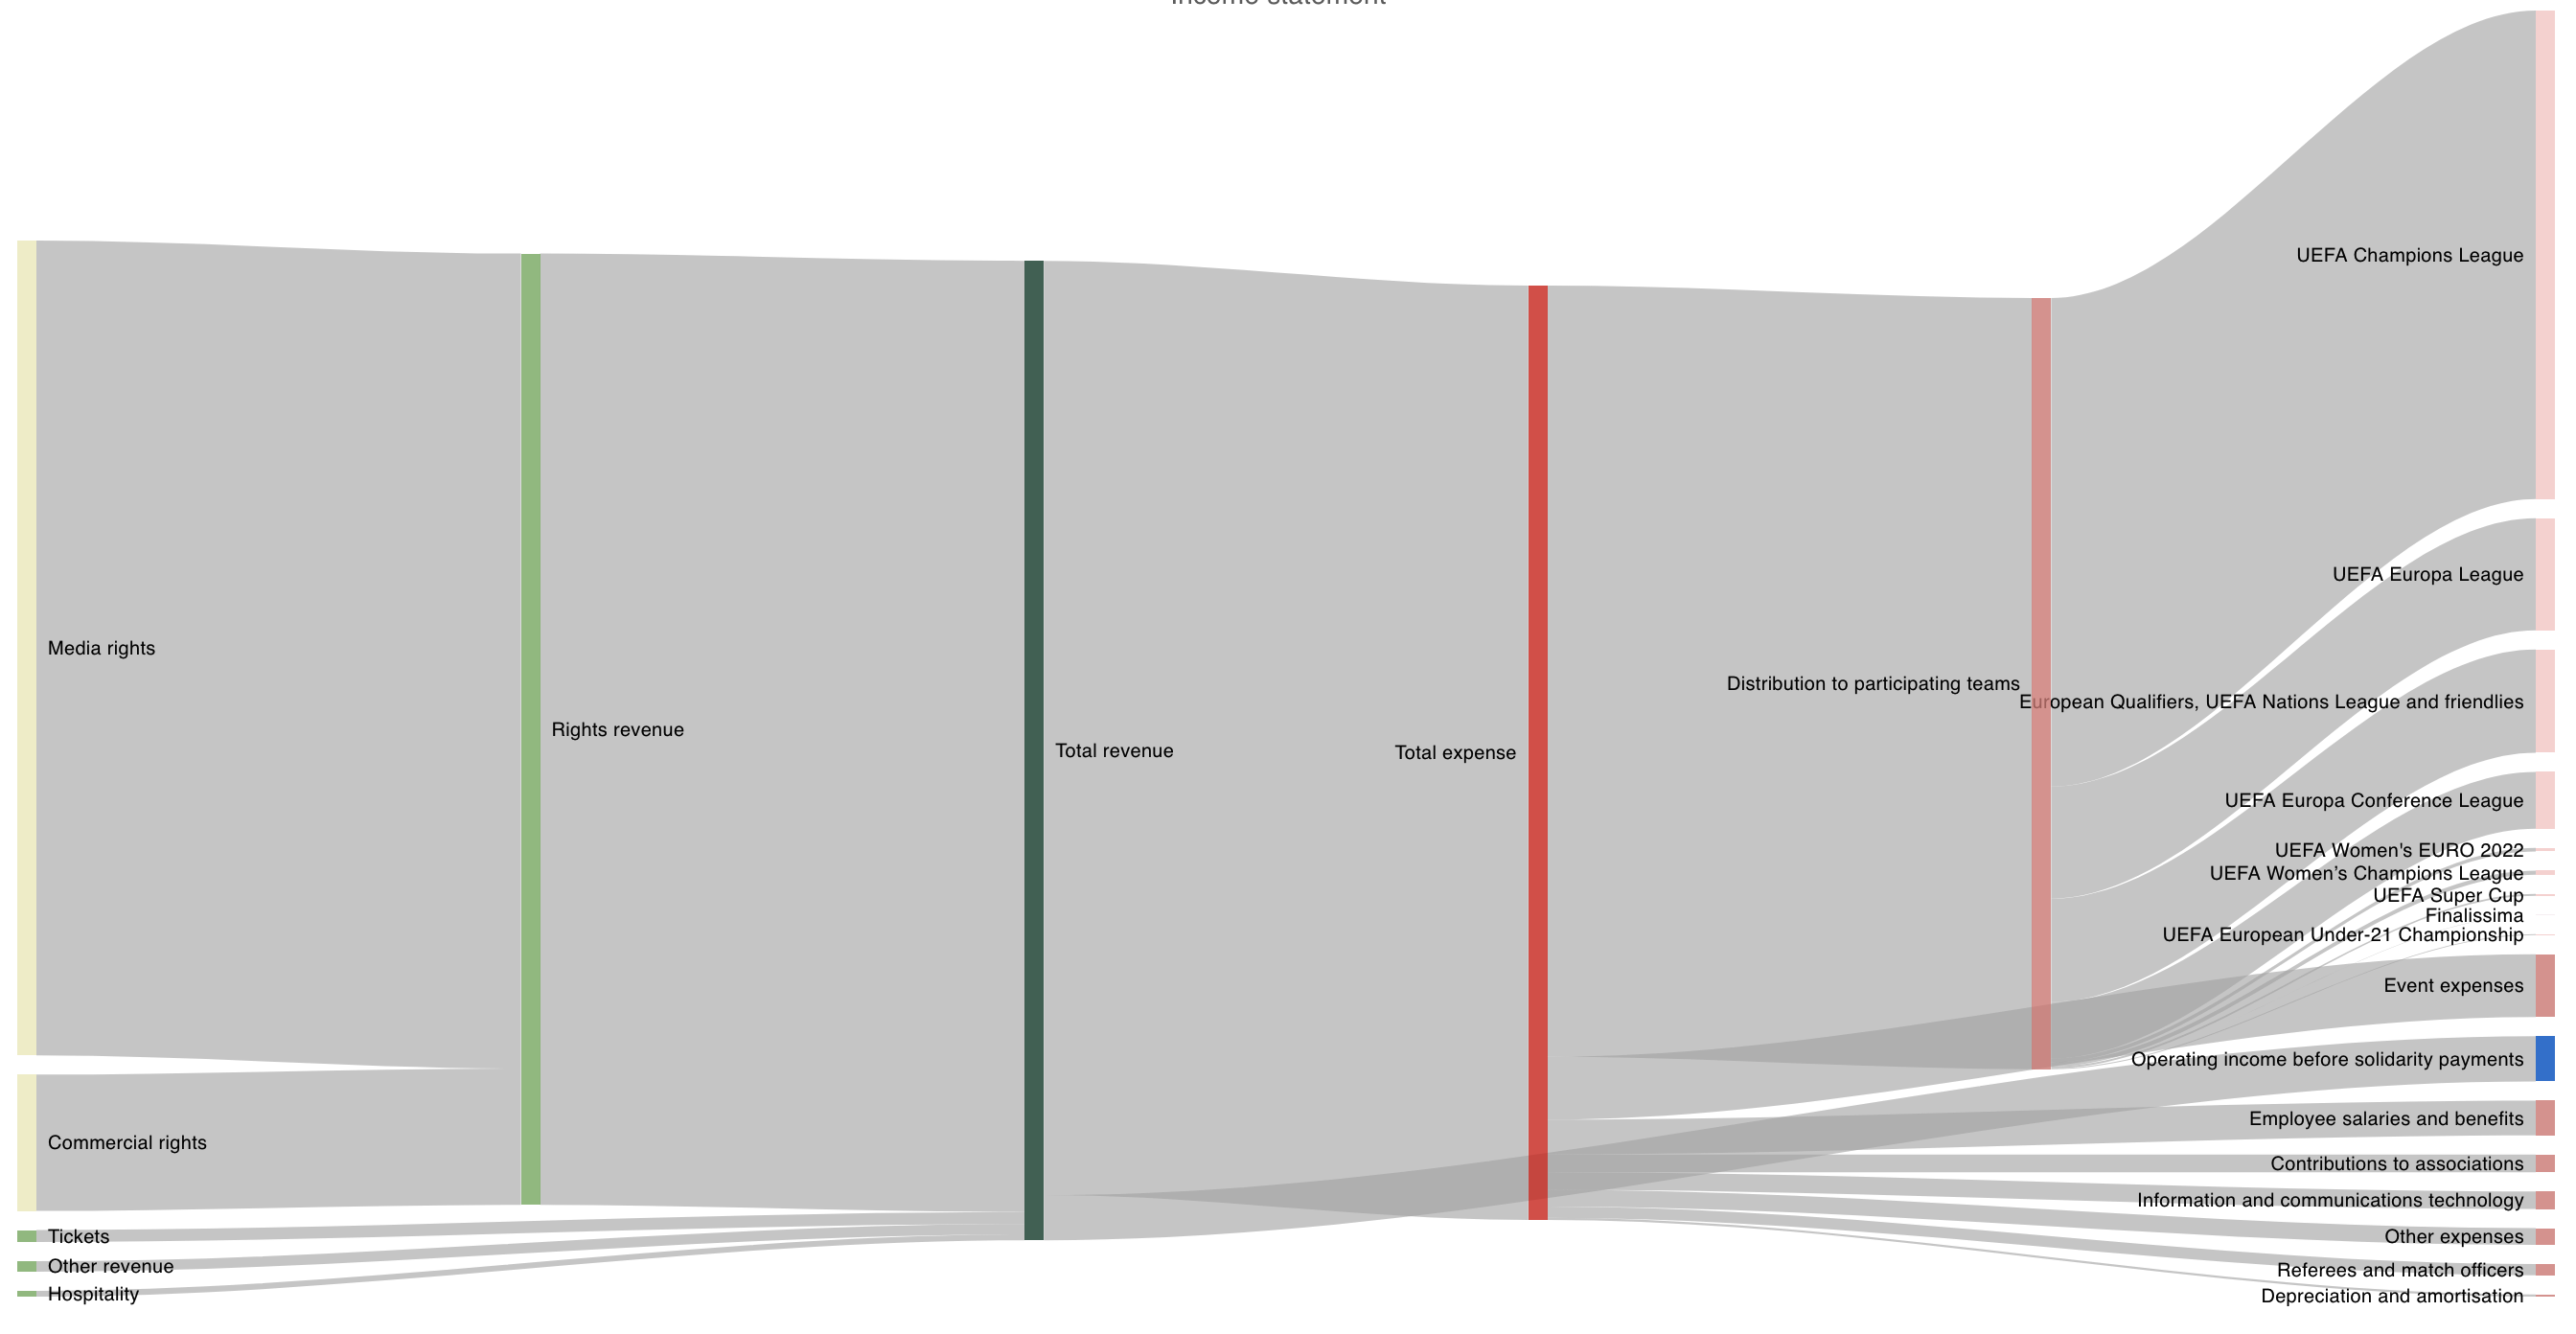
- slide1: distribution to competitions breakdown
- slide2: income statement (screenshot attached)
- slide 1: Player birth month histogram (mouse hover for each player)
- slide 2: Average age by nationality, position
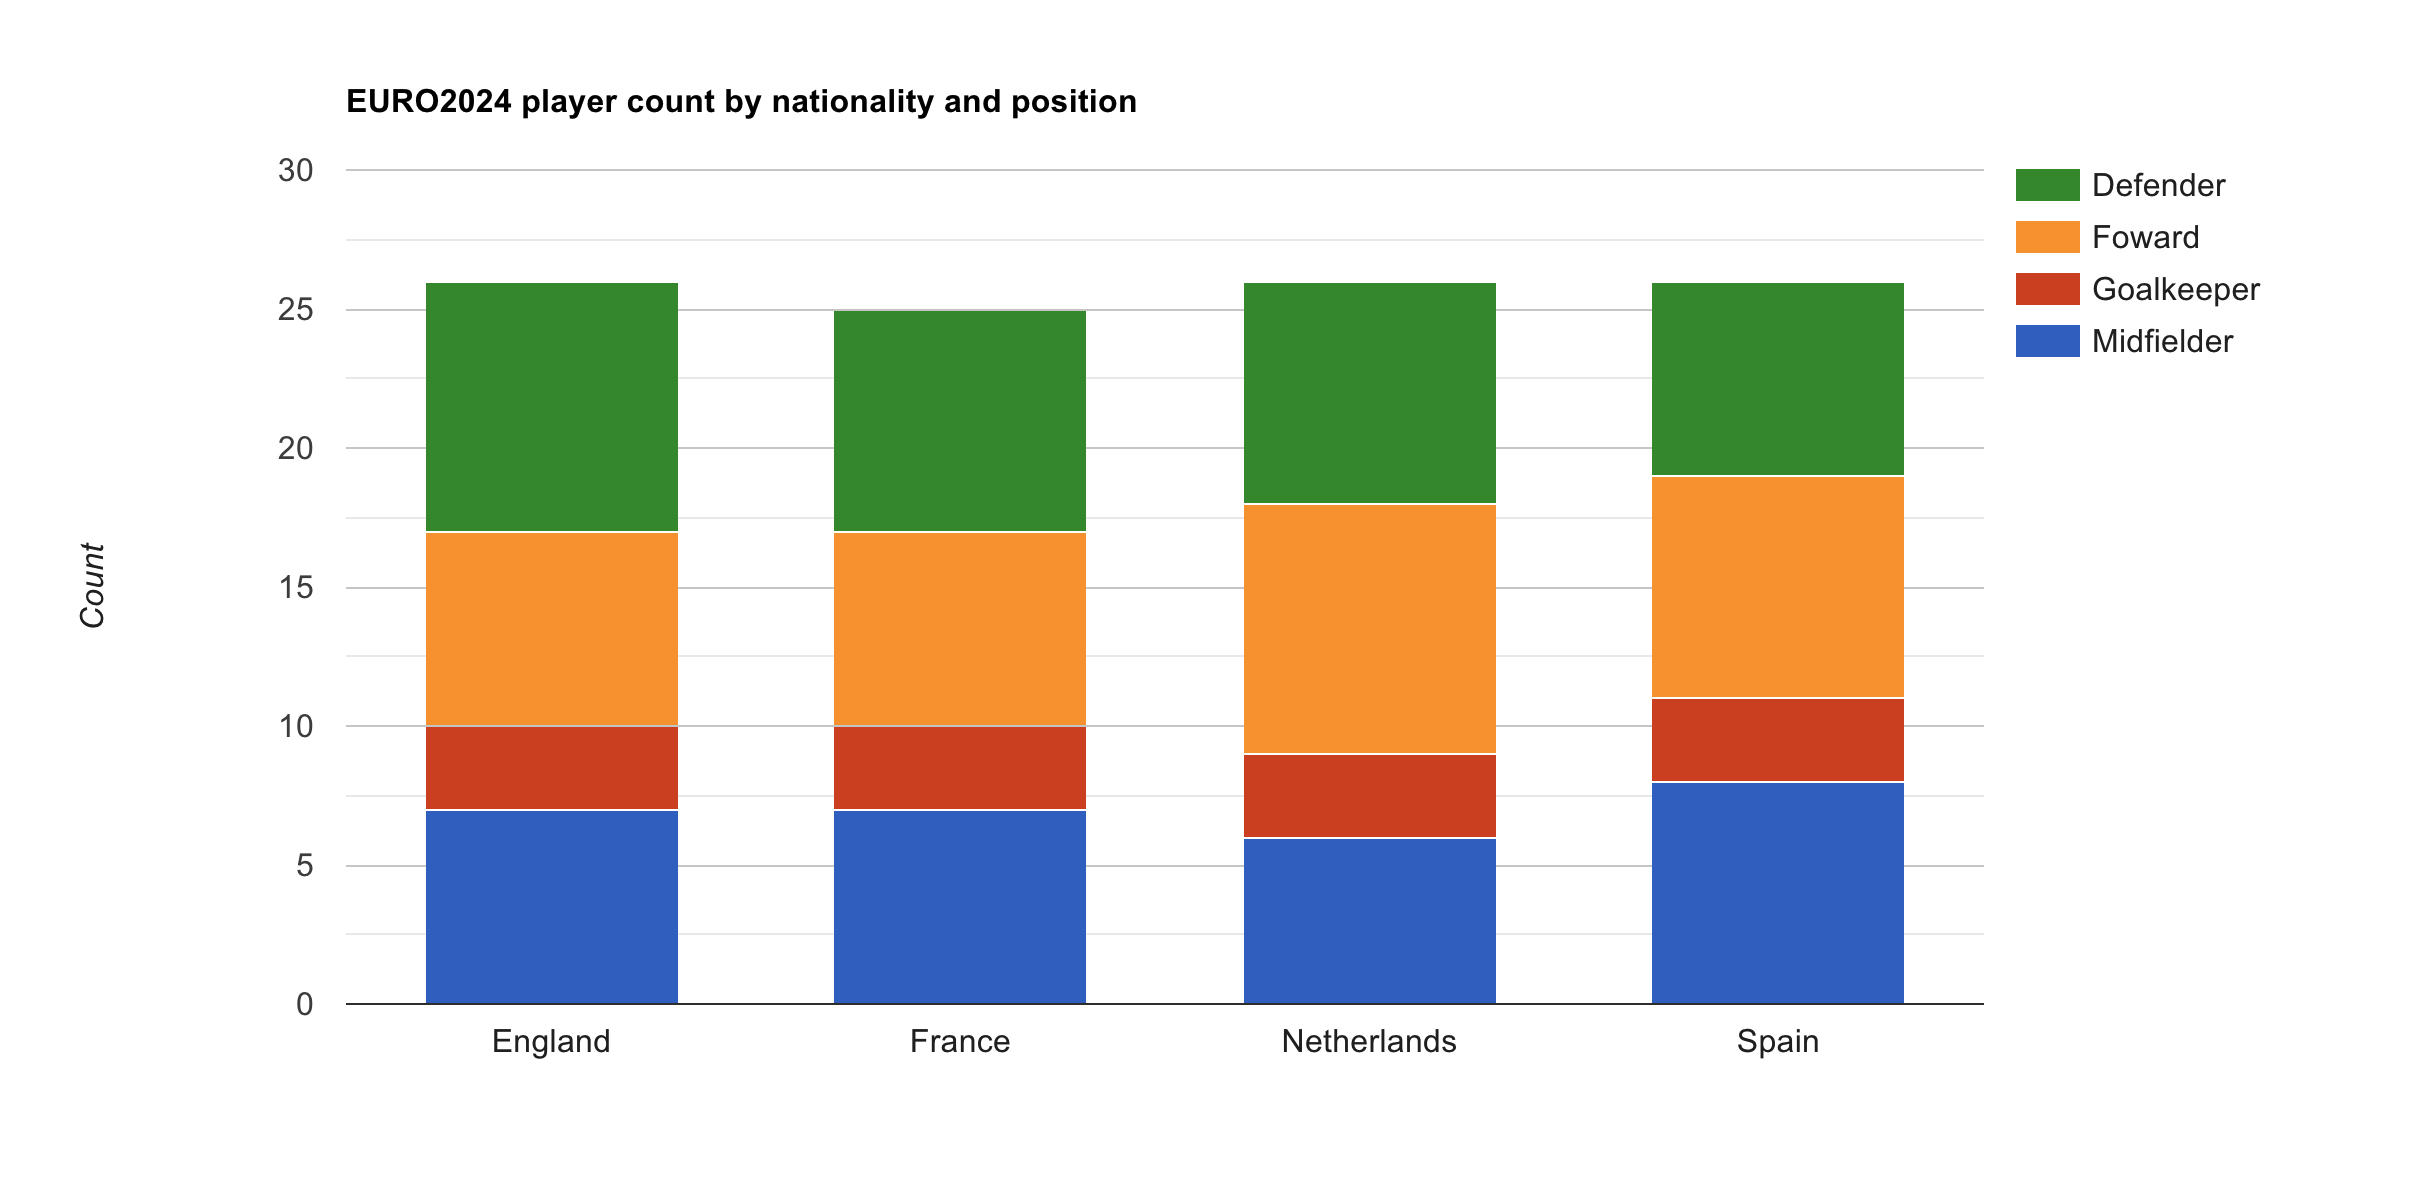
- slide 3: Player count by nationality and position
Link to data slides
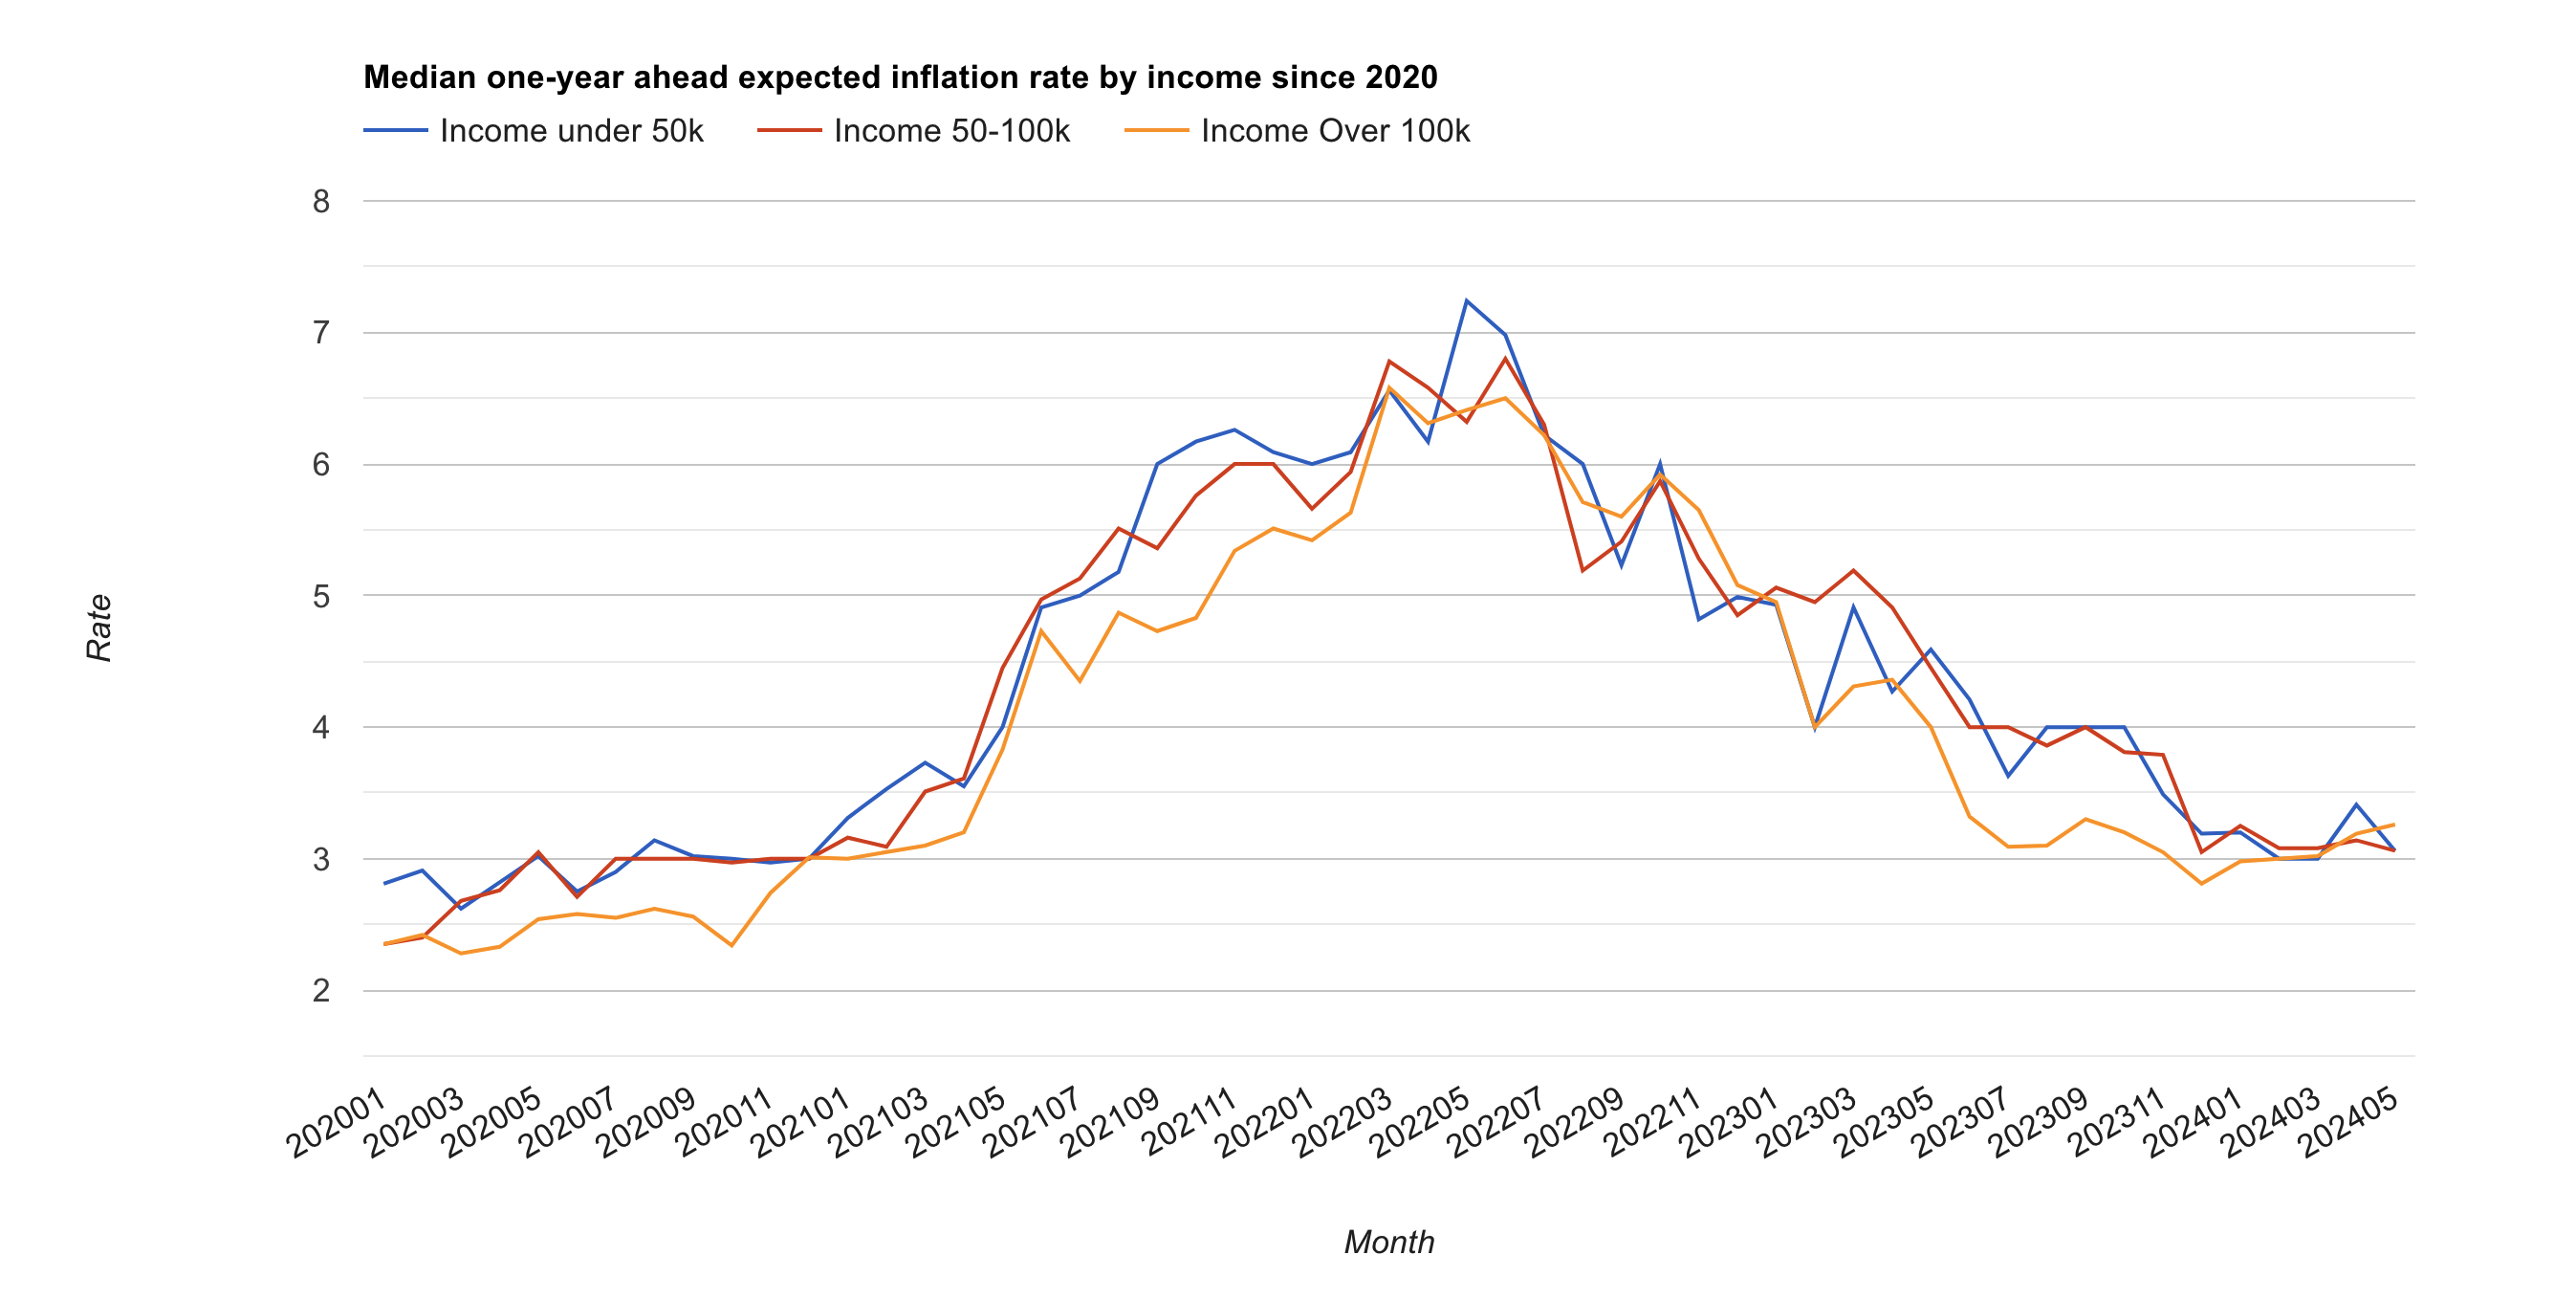
- slide 1: one-year ahead inflation expectation (screenshot attached)
- slide 2: earning growth expectation
- slide 3: probability of finding a job
- slide 4: probability of unemployment rate will be higher
link to data slides
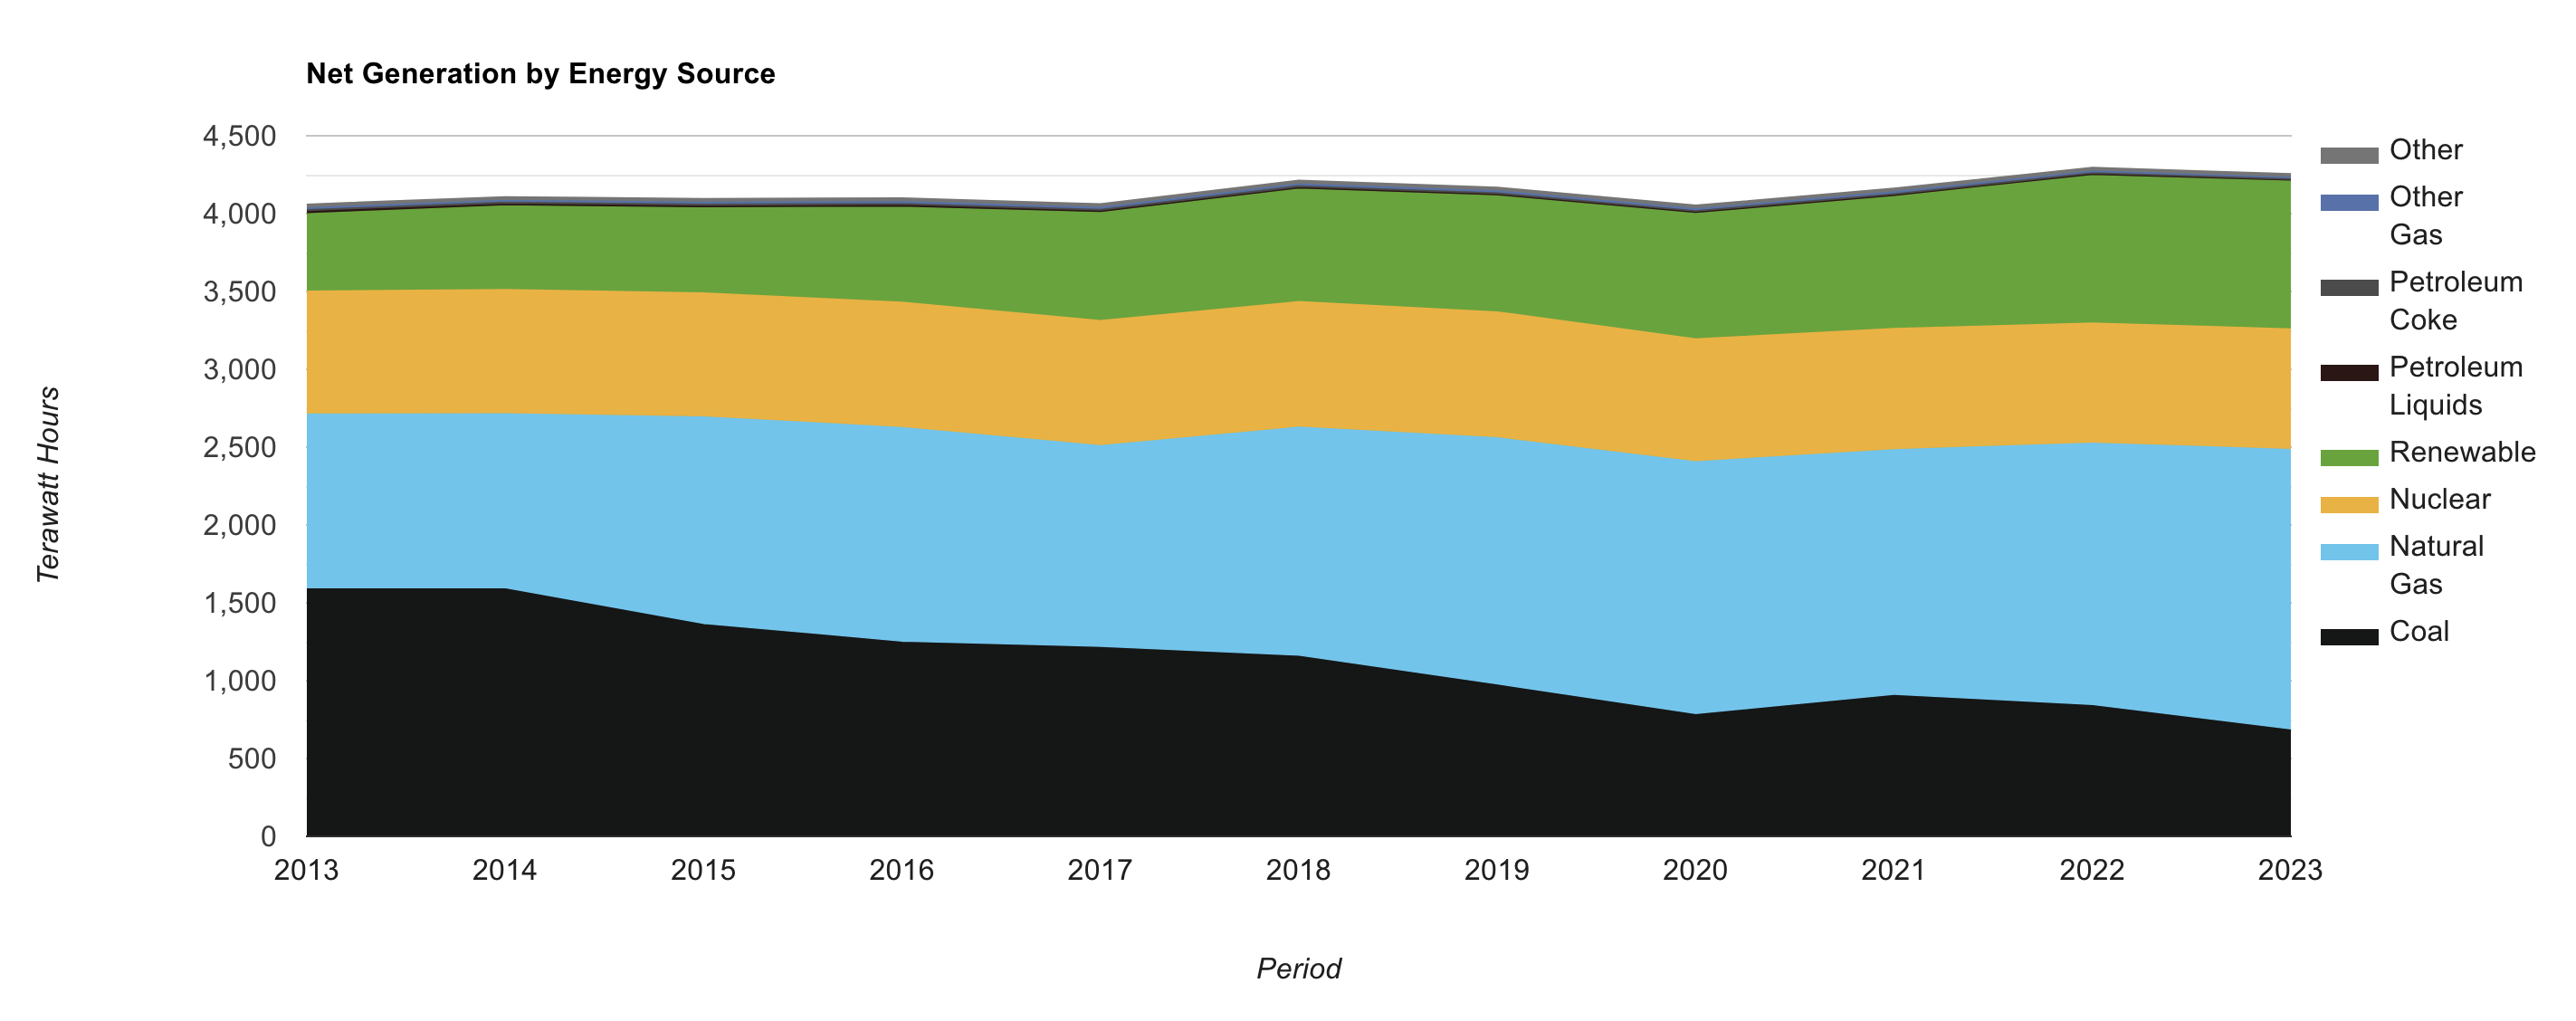
- slide 1: Electricity net generation by energy source (screenshot attached)
- slide 2: Electricity net generation by renewable sources
- slide 3: Electricity generation & consumption flow
link to data slides
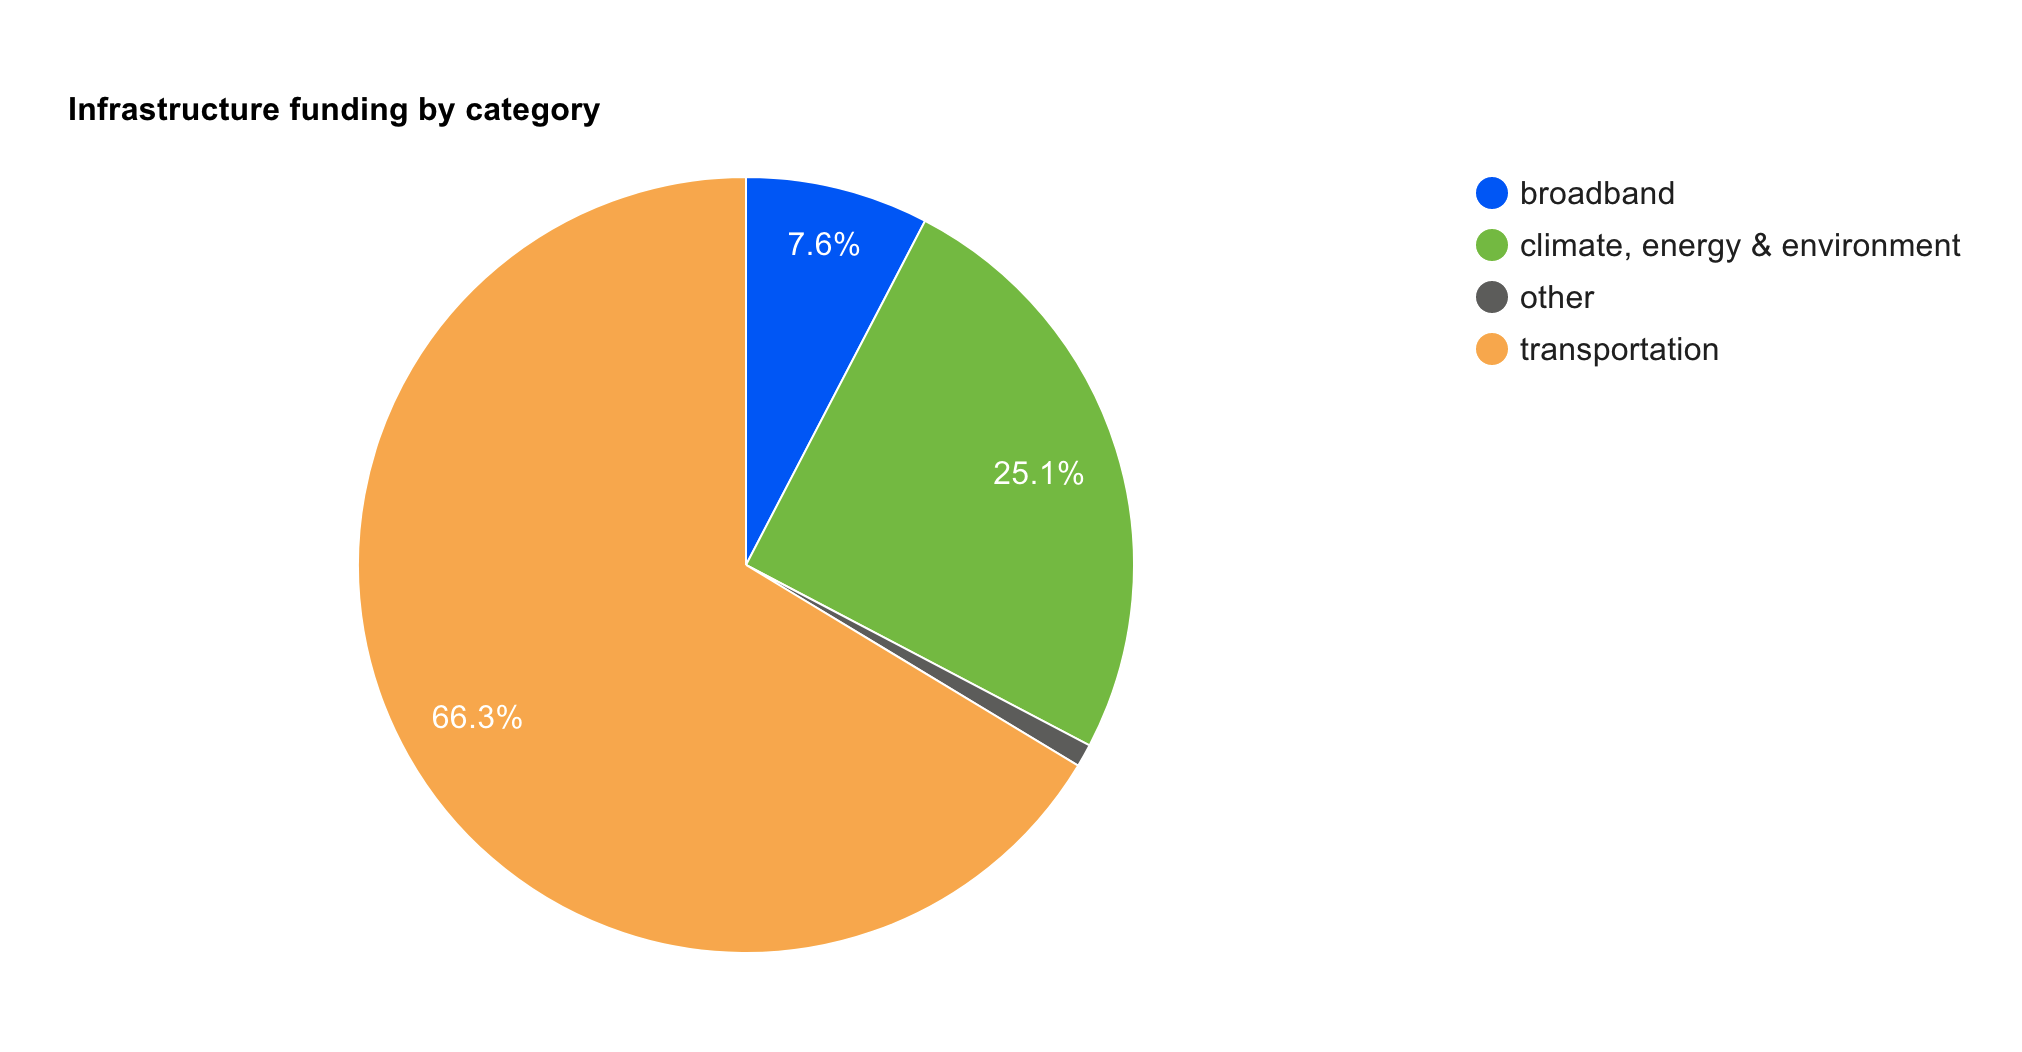
Funding stats for Infrastructure and job act
- slide 1: funding by category (screenshot attached)
- slide 2: funding rank among sub-category
- slide 3: top 20 funded program
link to data slides
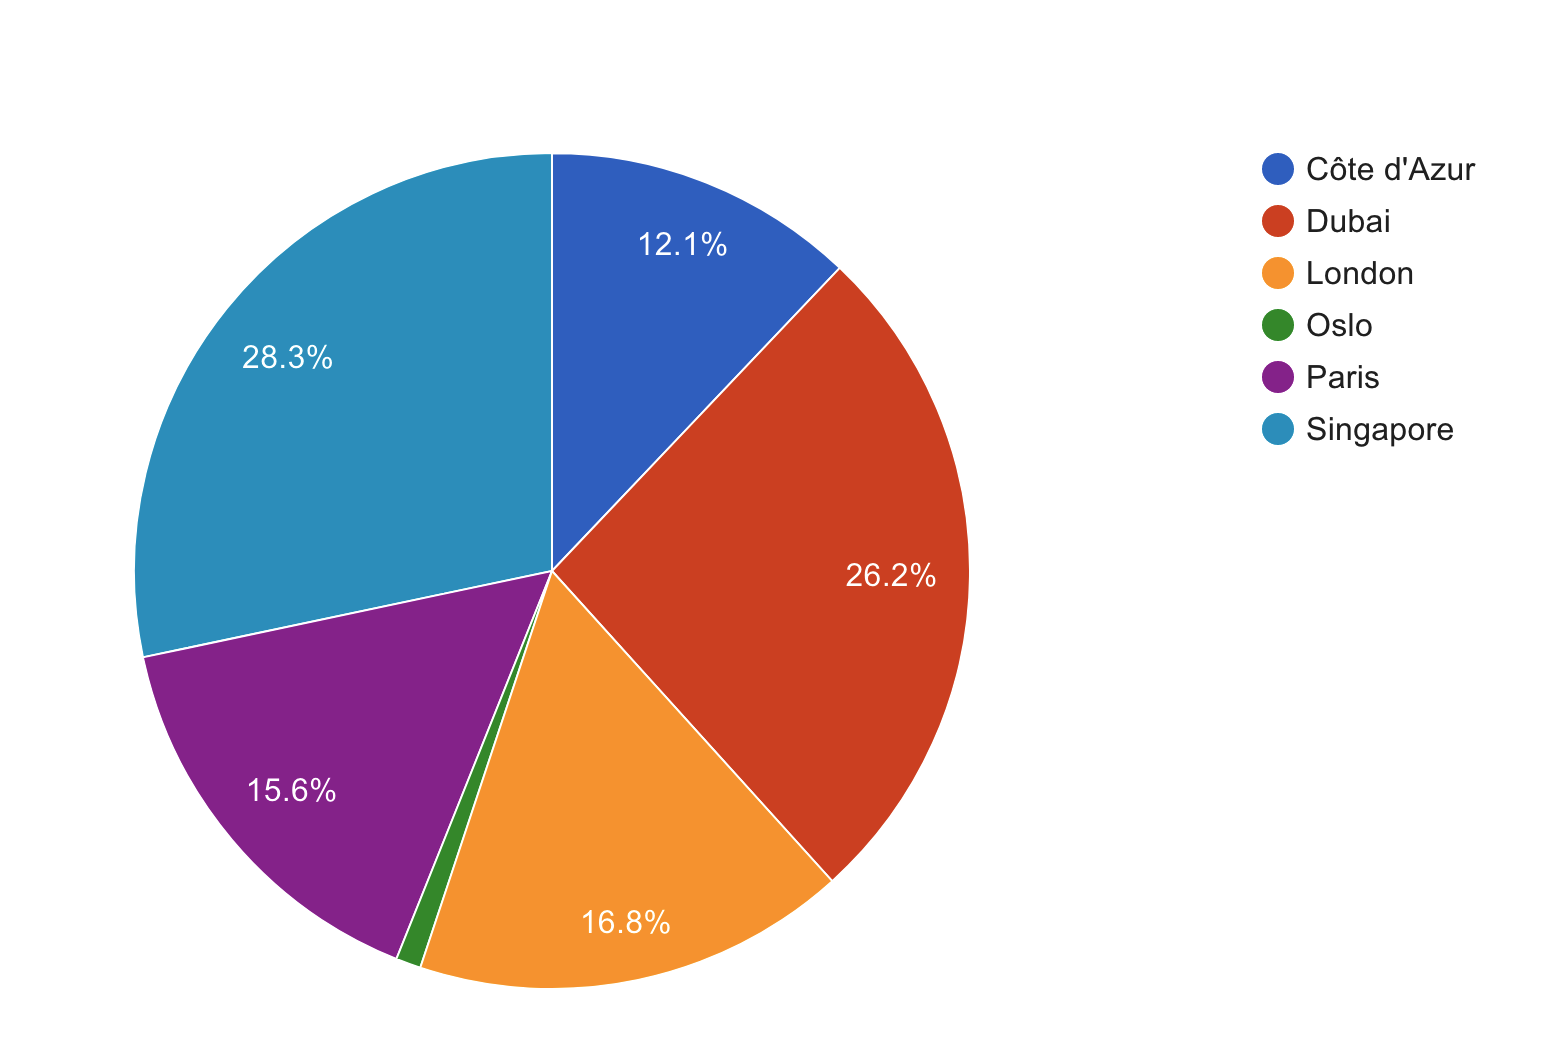
- slide1: Owner and city of offshore real estate wealth
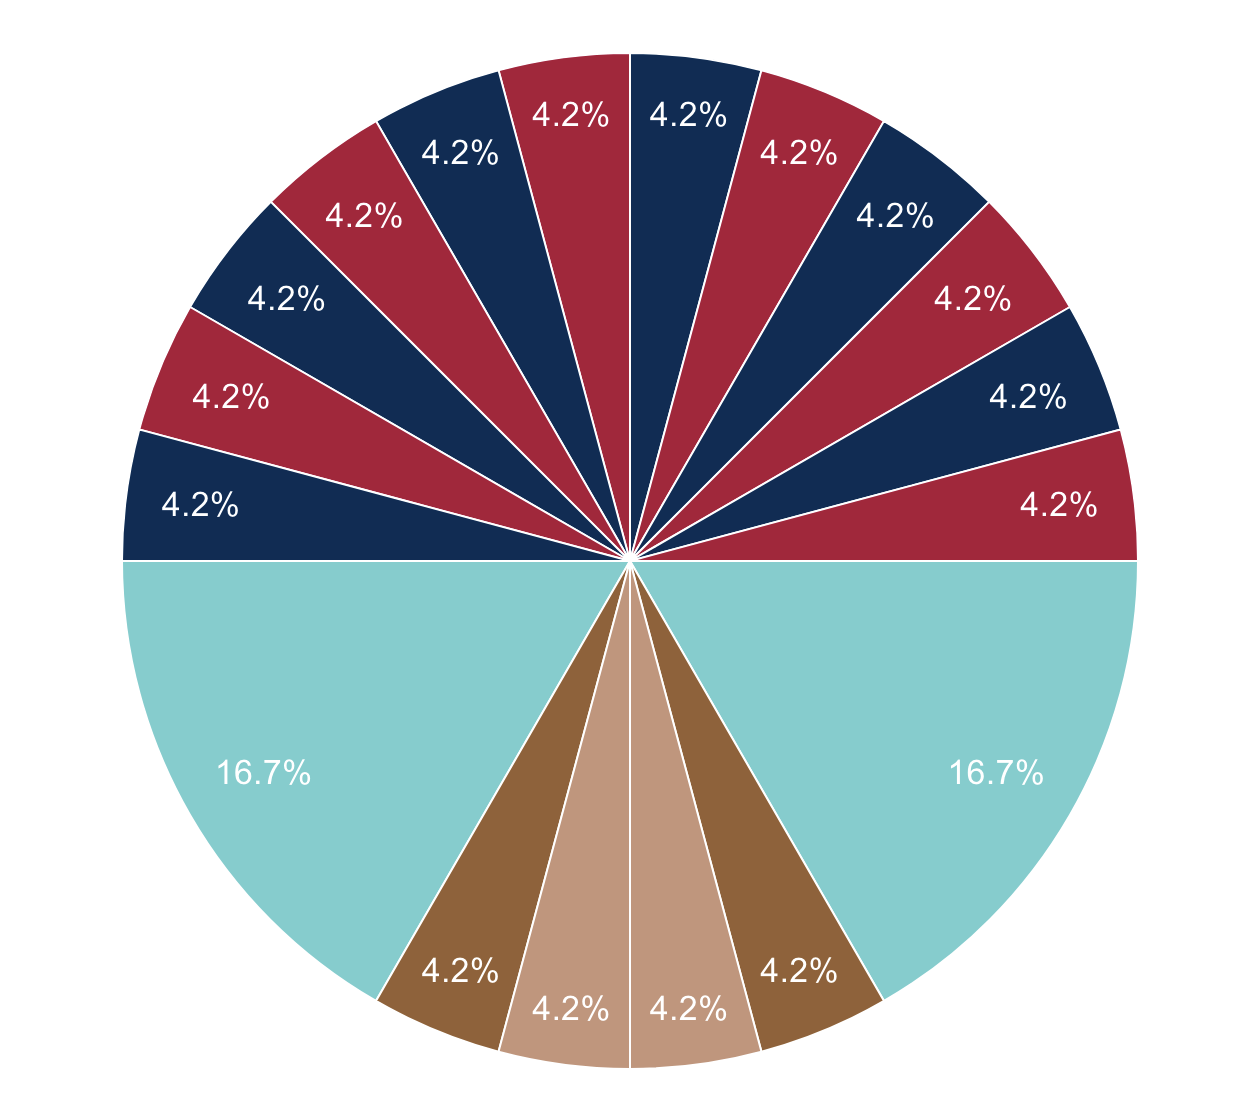
- slide2: Percentage of offshore real estate wealth (screenshot attached)
- slide3: Rank of offshore real estate wealth in billion USD
link to data slides
Hmm ... not sure ... It may depend on device and browser as well
Ha, try rotate 90 degree
yes, it show percentage, for actual sales data, click the link and hover on the slice with laptop. mobile / phone may not work
view more: next ›
And commissions paid to travel agent takes a big chuck around 15% :(