link to data slides slides
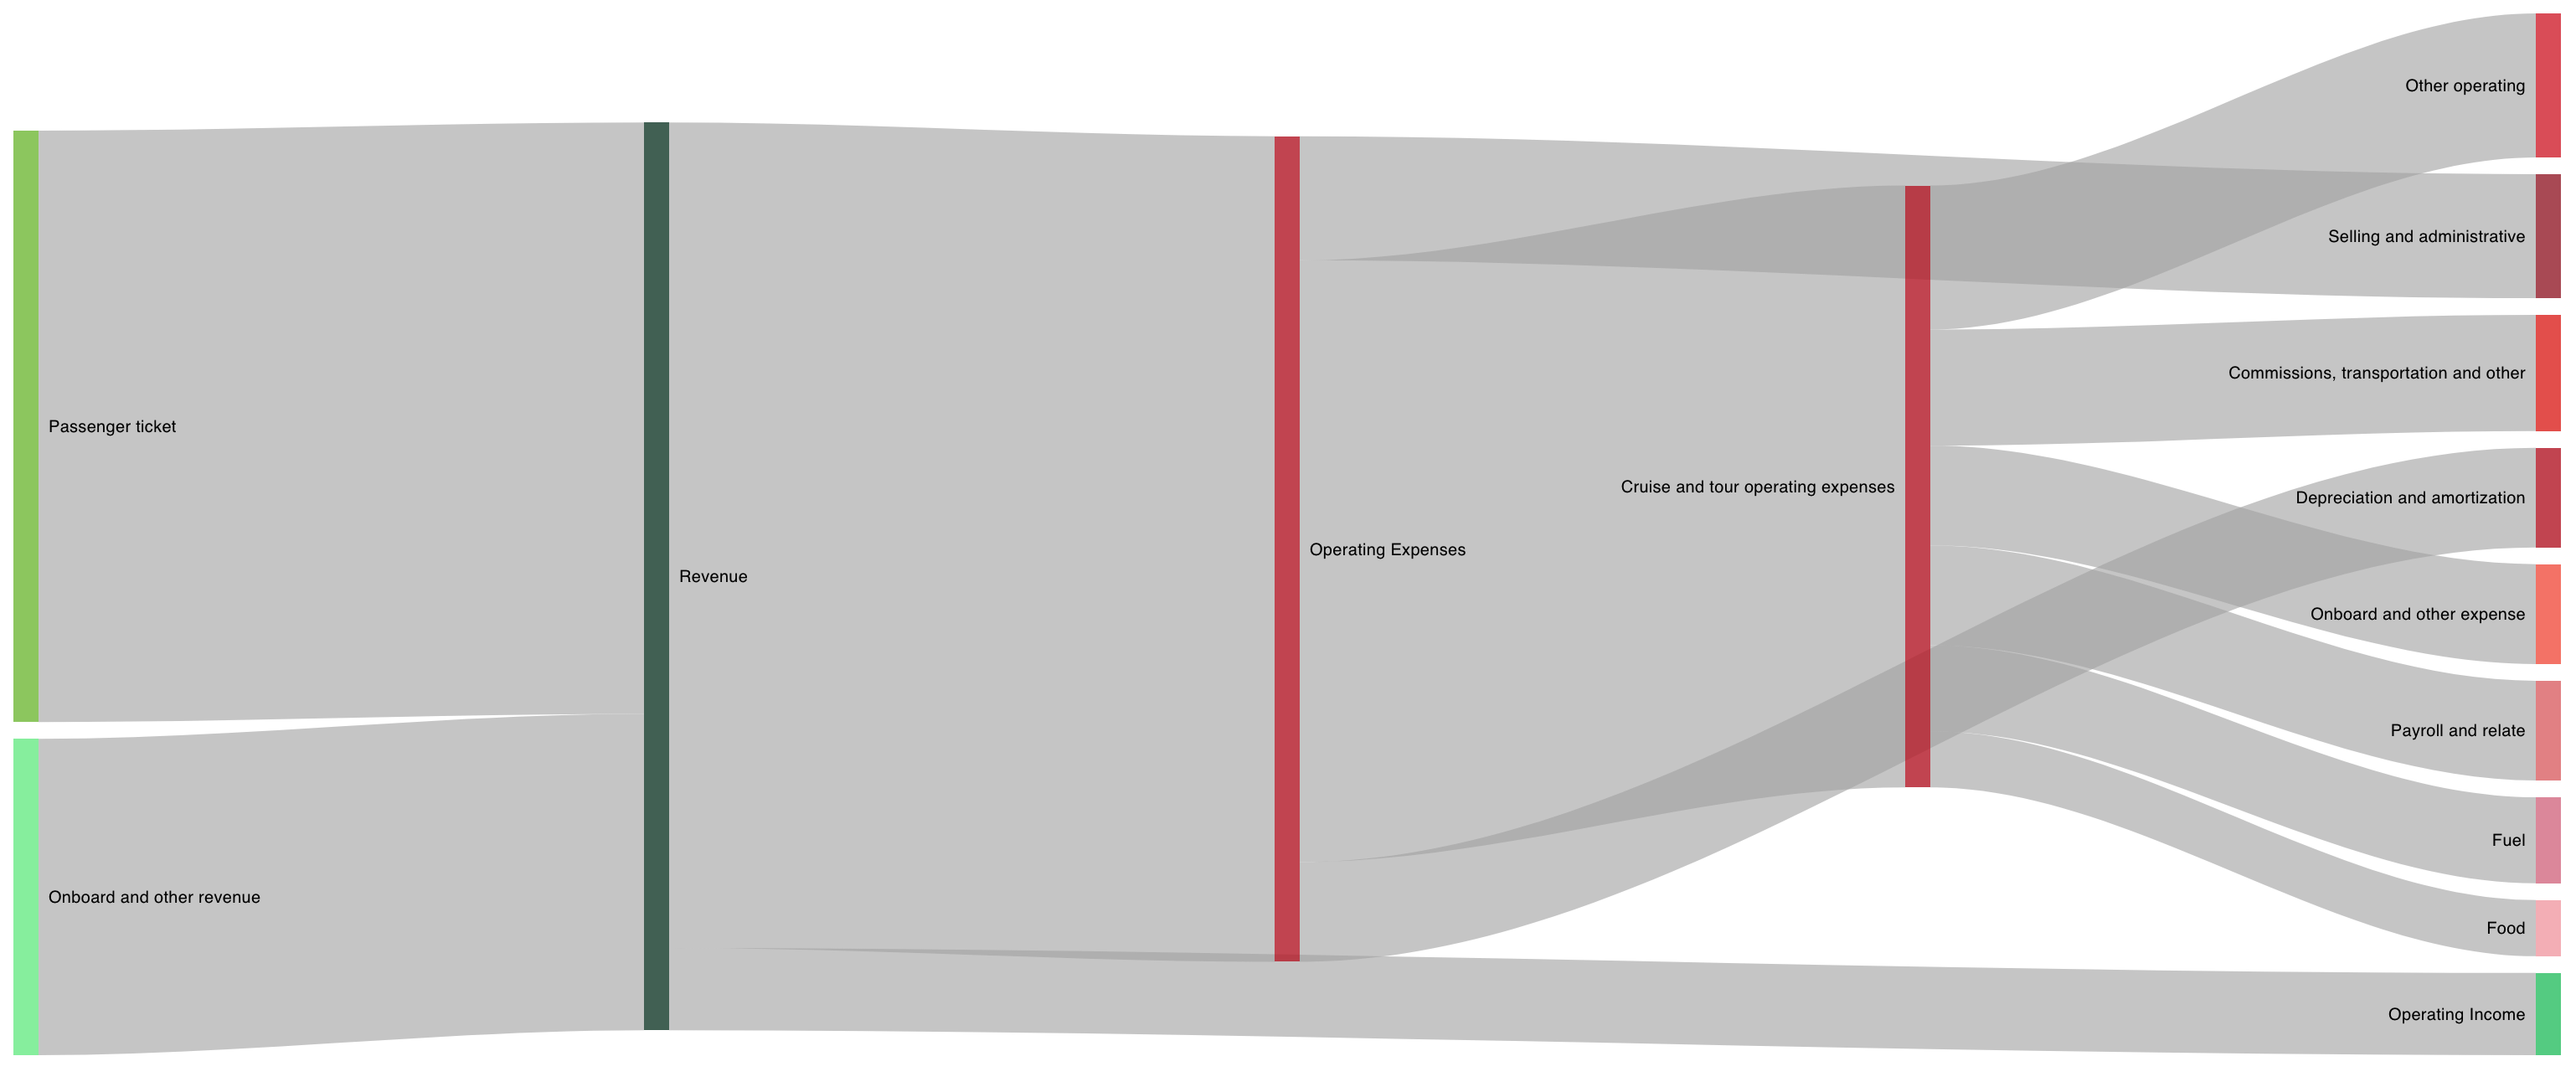
- Carnival income statement (in millions) - image attached
- Royal Caribbean
- Norwegian
- Compare cruises and tour operating expenses among three ^^
Welcome to color4data community!
Rules:
link to data slides slides
Why is operating expenses on here twice?
Also, this would be better as a stacked bar graph.
Cruise operating expense is part of total operating expense. Total = cruise + sell & admin + depreciation And yes, in data slides, you may find bar graph in last slides
Food is a worryingly small bar.
And commissions paid to travel agent takes a big chuck around 15% :(