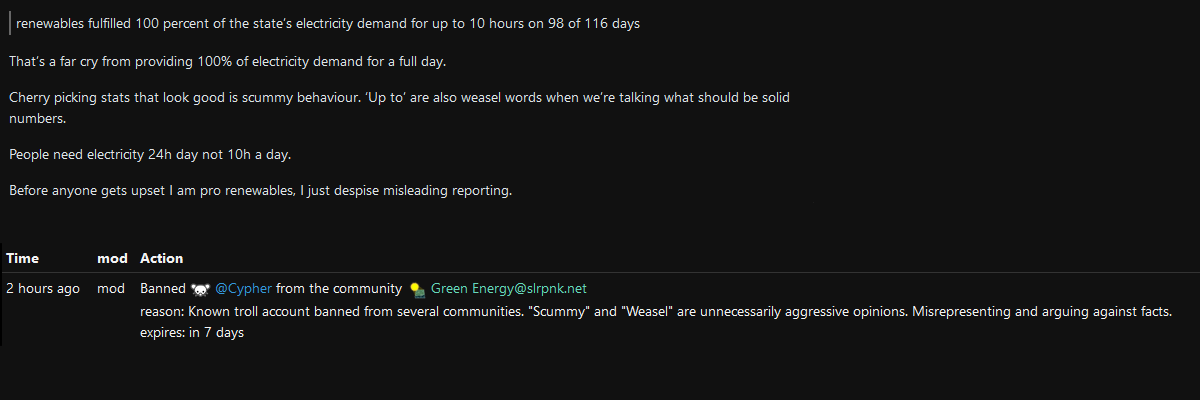
this post was submitted on 25 Jan 2025
89 points (89.4% liked)
Ye Power Trippin' Bastards
736 readers
149 users here now
This is a community in the spirit of "Am I The Asshole" where people can post their own bans from lemmy or reddit or whatever and get some feedback from others whether the ban was justified or not.
Sometimes one just wants to be able to challenge the arguments some mod made and this could be the place for that.
Posting Guidelines
All posts should follow this basic structure:
- Which mods/admins were being Power Tripping Bastards?
- What sanction did they impose (e.g. community ban, instance ban, removed comment)?
- Provide a screenshot of the relevant modlog entry (don’t de-obfuscate mod names).
- Provide a screenshot and explanation of the cause of the sanction (e.g. the post/comment that was removed, or got you banned).
- Explain why you think its unfair and how you would like the situation to be remedied.
Rules
- Post only about bans or other sanctions that you have received from a mod or admin.
- Don’t use private communications to prove your point. We can’t verify them and they can be faked easily.
- Don’t deobfuscate mod names from the modlog with admin powers.
- Don’t harass mods or brigade comms. Don’t word your posts in a way that would trigger such harassment and brigades.
- Do not downvote posts if you think they deserved it. Use the comment votes (see below) for that.
- You can post about power trippin’ in any social media, not just lemmy. Feel free to post about reddit or a forum etc.
- If you are the accused PTB, while you are welcome to respond, please do so within the relevant post.
Expect to receive feedback about your posts, they might even be negative.
Make sure you follow this instance's code of conduct. In other words we won't allow bellyaching about being sanctioned for hate speech or bigotry.
YTPB matrix channel: For real-time discussions about bastards or to appeal mod actions in YPTB itself.
Some acronyms you might see.
- PTB - Power-Tripping Bastard: The commenter agrees with you this was a PTB mod.
- YDI - You Deserved It: The commenter thinks you deserved that mod action.
- BPR - Bait-Provoked Reaction: That mod probably overreacted in charged situation, or due to being baited.
- CLM - Clueless mod: The mod probably just doesn't understand how their software works.
Relevant comms
founded 6 months ago
MODERATORS
you are viewing a single comment's thread
view the rest of the comments
view the rest of the comments
Yeah. The best possible interpretation is that in 85% of the days measured (98/116), power was covered for 42% of the day (10/24), for an end result of 35% of power needs being covered over the time measured ((98/116)×(10/24)).
But that is interpreting "up to" as meaning it was consistently hitting 10 hours each of those 98 days, which is definitively not what "up to" means. So we'll use 35% as our upper bound, being the most charitable interpretation.
So if we assume that the 18 days not covered had 0 hours of coverage (only sane way they can't be counted when using the term "up to"), and make a complete assumption backed by nothing that each day counted as covered had 1 hour minimum of power needs met, then we can establish the lower bound.
Worst case interpretation then becomes one day at 10 hours plus 97 days at one hour. (((1/116)×(10/24))+((97/116)×(1/24)))
So lower bound of 4% coverage using the least charitable sane interpretation.
So that statistic as written comes out somewhere between 4% and 35% of total energy needs met entirely by renewables over that 116 day period.
Quite a different feel to that than 100% of the energy needs were met some of the time.
Honestly, even 10% of the total needs met would be impressive, and for the sake of continued human existence we need to keep investing in renewables regardless.
But misleading people shouldn't be acceptable just because it's for a cause we favor.
I really appreciate you providing numbers on this, I was hesitant to set upper and lower bounds and get called out for making assumptions (which it isn’t!).
As anyone can see from your comment the ambiguity in the articles claims are extremely unhelpful.
All this only makes being banned for ‘arguing against facts’ even sadder.
From the linked study's abstract:
(Admittedly, it was 3 clicks away. Here's a direct link: https://www.sciencedirect.com/science/article/abs/pii/S0960148124023309 )
Getting off topic. Please stay on topic of whether the mod action was deserved rather than discussing the article itself
you're right, but how can they discuss the article in the actual post under threat of bans for clarifying what is misleading in it 🤷 it has become a bit paradox
can be higher. Daytime hours have higher demand, and stat can mean that demand was covered for x hours, instead of production equal to 10/24th of demand.
unlikely. But a reason the spring period is being highlighted is that there is no heating or cooling demand. There is more room for improvement for sure.