Cartography Anarchy
A community for Cartographers with nothing left to lose.
Rules:
Don't be awful Lemmy Guidelines Still Apply.
No direct upload images This is hosted on Lemm.ee- to post images, you must use an image upload service like Imgur to post maps.
We are agents of chaos I've created this to be the alternative to the community I used to manage on the website that shalt not be named "mapporncirclejerk"
Live and let die Meme trends happen, so please don't message mods asking to take down maps that are repetitive to a bit.
Reposts Vs. Covers Not all reposts are evil- if someone posts something that has been done years ago, it serves to bring old memes to the new users. I call these meme covers. However it can be done in excess which makes it a repost and spam. Mods will determine if a post is a cover or a repost.
No impersonating mods I can't believe I had to make this rule.
No harassing mods on an appeal We can talk it out, and we will be acting in good faith when making decisions. If you disagree with a removal, you are free to message for clarification or to appeal by giving some added context.
Bans Bans will be set to a maximum of 365 days for humans, and a minimum of 365 years for bots. I believe people can change, so if you are banned for good reason, do know that it is not permanent, it is just a way to say "take time to grow and come back when you are ready".
view the rest of the comments

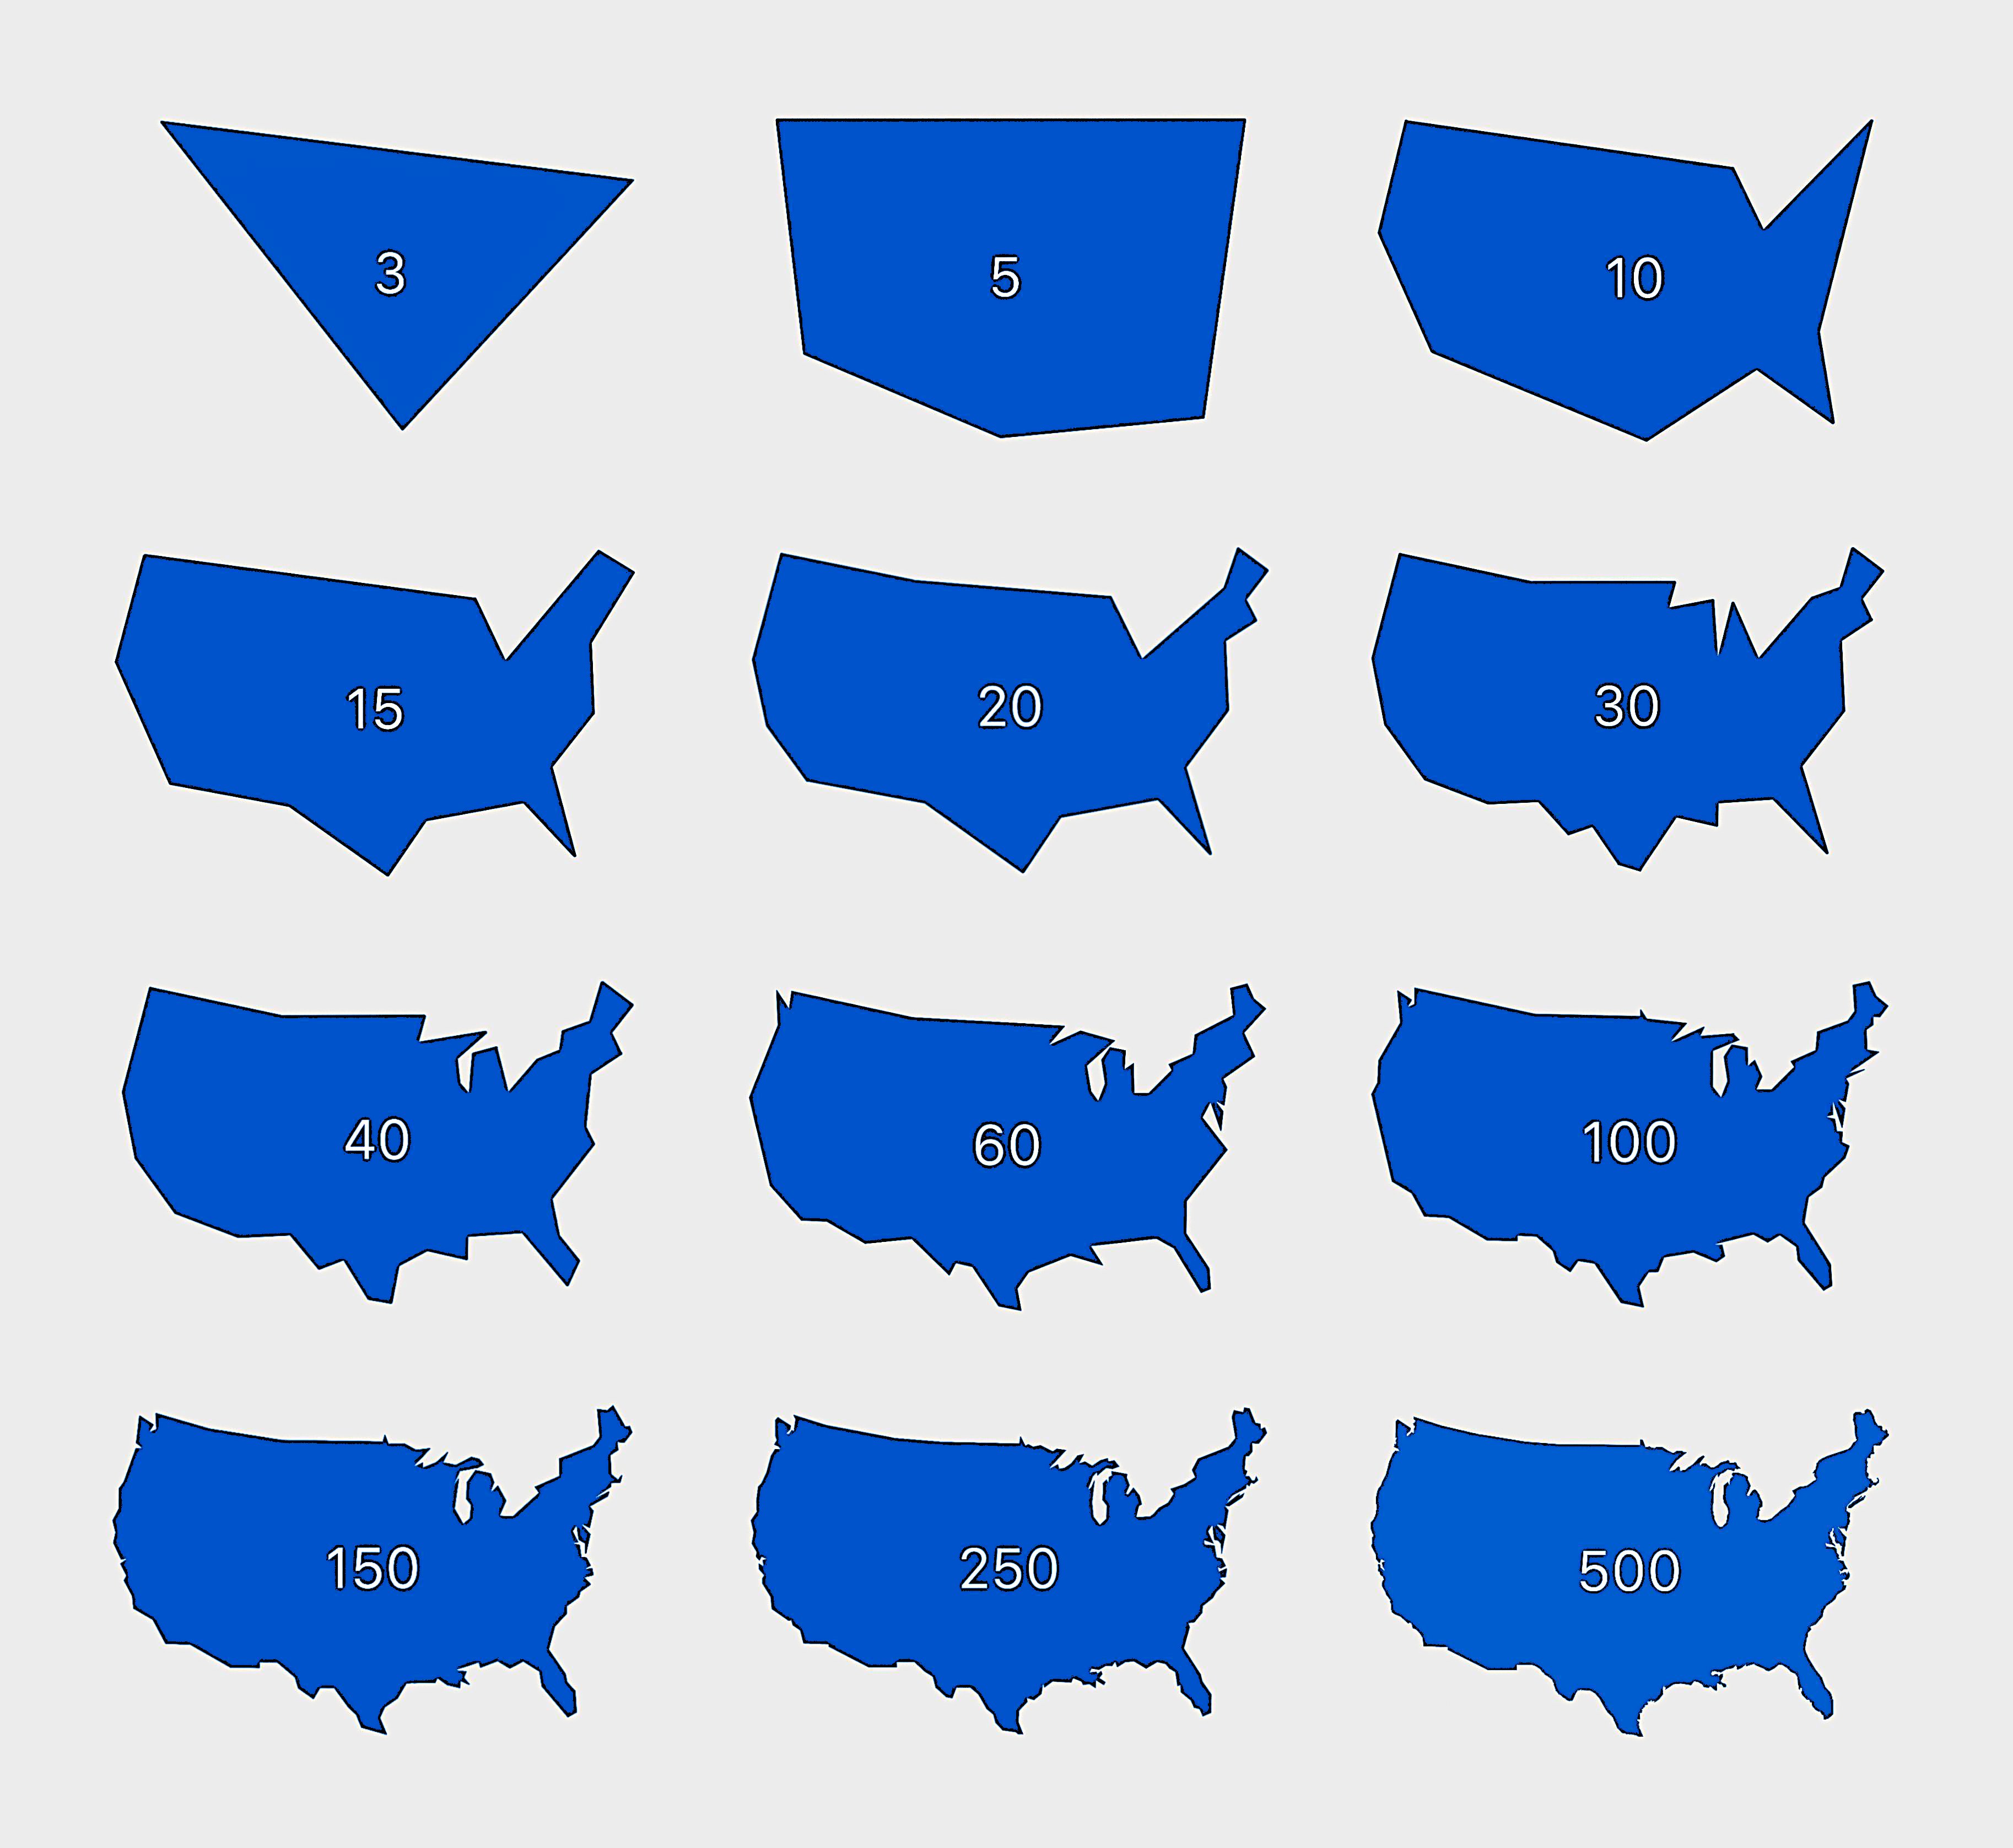
What's a systematic algorithm for finding the best approximation (minimal under/overshoot of area) when you are given a raster or vector image representing the "real" borders? Or it just trial and error?
For a raster image, you could count the number of true and false positive pixels and true and false negative pixels. Then use statistical metrics for binary classification, like sensitivity and specificity. I guess you could even make an ROC curve by measuring the true positive rate and false positive rate for varying number of edges in the model. I guess for a vector image you could do the same thing, just using the sum of overlapping and non-overlapping areas instead of pixel counts?
Oh I was thinking about something else and should have worded my question differently: for a given number of vertices, how do you find the coordinates that cover most of the area. So for instance for 3 vertices (triangle): where do you place the three points so that you cover as close as 100% of the area as possible? Overshooting would be allowed, ie a triangle that has an area of 120% of the US would be better than one that has 70%.
Yeah, i think minimizing the difference in area would be the primary goal, but you'd need to add additional constraints, like also minimizing the number of times that your edges cross the true perimeter, minimizing the non-overlapping area, or something like that. I dunno for sure, but this sounds like a fun problem. I might give it a shot this weekend. I'm in the early days of trying to learn rust (after years of pure python for work and school), and I'm always looking for toy problems to test myself with!
I'd imagine it would be a case by case basis.