This is the 2024 update to last year's Eugene/Springfield crime report.
Numbers are derived from calls published on the EPD and SPD dispatch logs.
Note that not all calls are published (e.g. Suicidal Subject), not all calls result in dispatch of an officer, and not all calls are actionable (i.e. an officer is dispatched, but the person/problem is not found).
Daily crime map available here.
All Calls (except Traffic Stops)

 Year   Eugene        Springfield
------ ------------- ---------------
 2014   50,042         28,534
 2015   51,669 +3.3%   28,772  +0.8%
 2016   51,366 -0.6%   29,838  +3.7%
 2017   49,580 -3.5%   29,855  +0.1%
 2018   45,683 -7.9%   28,736  -3.7%
 2019   47,141 +3.2%   27,501  -4.3%
 2020   47,078 -0.1%   24,705 -10.2%
 2021   47,088  0.0%   24,611  -0.4%
 2022   45,046 -4.3%   25,001  +1.6%
 2023   44,021 -2.3%   23,055  -7.8%
 2024   43,319 -1.6%   22,486  -2.5%
Traffic Stop

 Year   Eugene         Springfield
------ -------------- --------------
 2014   17,018         11,401
 2015   13,710 -19.4%  10,603  -7.0%
 2016   11,894 -13.2%  10,212  -3.7%
 2017   10,905  -8.3%  10,932  +7.1%
 2018    8,908 -18.3%   9,184 -16.0%
 2019    9,834 +10.4%   8,928  -2.8%
 2020   12,901 +31.2%   6,253 -30.0%
 2021   10,738 -16.8%   5,241 -16.2%
 2022    8,748 -18.5%   4,440 -15.3%
 2023    9,651 +10.3%   5,737 +29.2%
 2024   10,587  +9.7%   6,114  +6.6%
Criminal Trespass
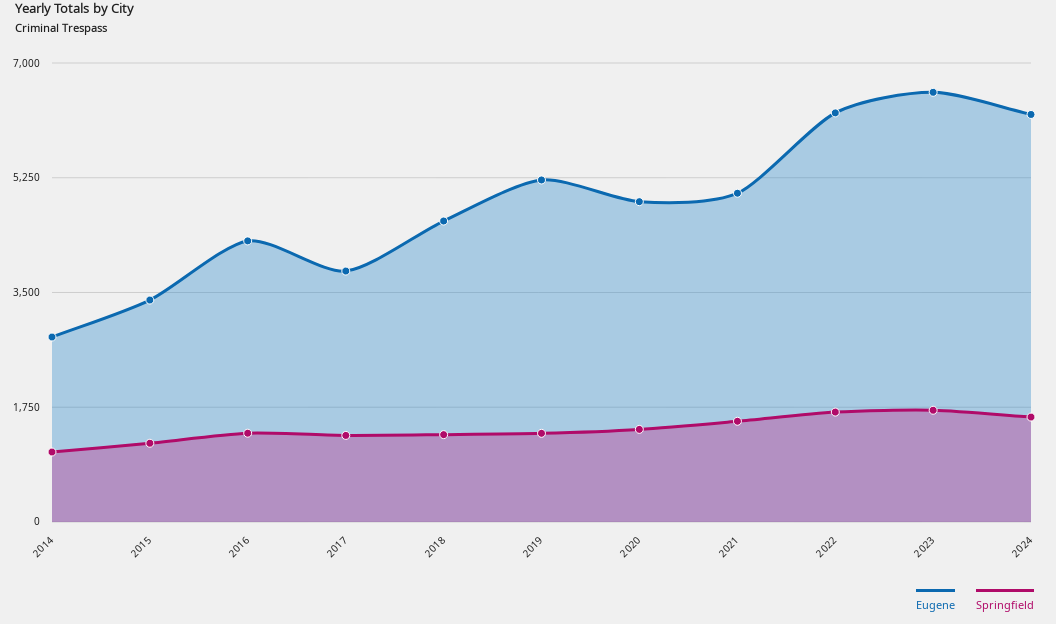
 Year   Eugene        Springfield
------ ------------- -------------
 2014   2,821         1,067
 2015   3,385 +20.0%  1,201 +12.6%
 2016   4,287 +26.6%  1,354 +12.7%
 2017   3,827 -10.7%  1,320  -2.5%
 2018   4,590 +19.9%  1,332  +0.9%
 2019   5,216 +13.6%  1,352  +1.5%
 2020   4,885  -6.3%  1,412  +4.4%
 2021   5,014  +2.6%  1,536  +8.8%
 2022   6,239 +24.4%  1,676  +9.1%
 2023   6,553  +5.0%  1,704  +1.7%
 2024   6,215  -5.2%  1,600  -6.1%
Shoplifter(s)

 Year   Eugene       Springfield
------ ------------ -------------
 2014   120          39
 2015   121   +0.8%  50  +28.2%
 2016   128   +5.8%  81  +62.0%
 2017    72  -43.8%  80   -1.2%
 2018    68   -5.6%  47  -41.3%
 2019   111  +63.2%  29  -38.3%
 2020   301 +171.2%   6  -79.3%
 2021   375  +24.6%  22 +266.7%
 2022   506  +34.9%  18  -18.2%
 2023   504   -0.4%  16  -11.1%
 2024   723  +43.5%   8  -50.0%
Dispute
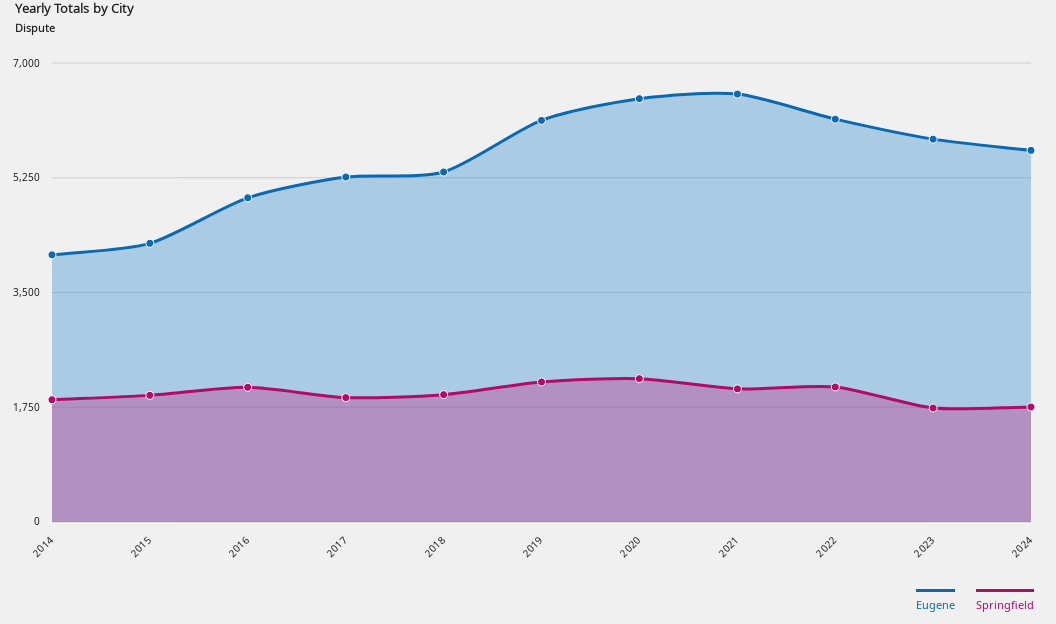
 Year   Eugene        Springfield
------ ------------- -------------
 2014   4,074         1,864
 2015   4,250  +4.3%  1,931  +3.6%
 2016   4,944 +16.3%  2,054  +6.4%
 2017   5,261  +6.4%  1,897  -7.6%
 2018   5,337  +1.4%  1,942  +2.4%
 2019   6,125 +14.8%  2,136 +10.0%
 2020   6,456  +5.4%  2,186  +2.3%
 2021   6,526  +1.1%  2,030  -7.1%
 2022   6,144  -5.9%  2,059  +1.4%
 2023   5,839  -5.0%  1,738 -15.6%
 2024   5,667  -2.9%  1,753  +0.9%
Disorderly Subject
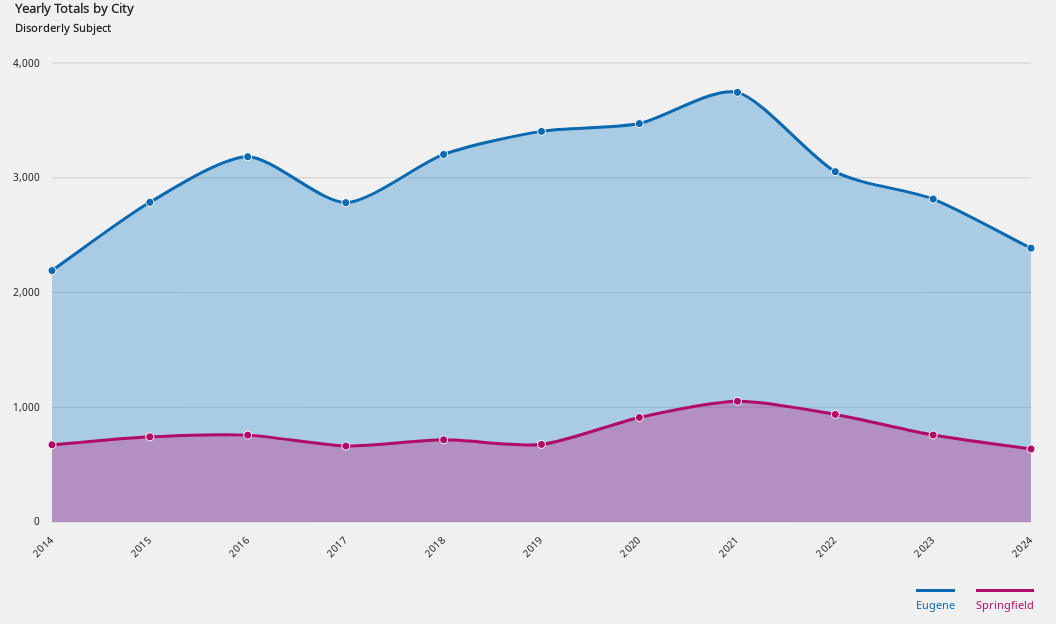
 Year   Eugene        Springfield
------ ------------- -------------
 2014   2,191           673
 2015   2,786 +27.2%    742 +10.3%
 2016   3,183 +14.2%    757  +2.0%
 2017   2,783 -12.6%    662 -12.5%
 2018   3,203 +15.1%    716  +8.2%
 2019   3,404  +6.3%    676  -5.6%
 2020   3,472  +2.0%    911 +34.8%
 2021   3,744  +7.8%  1,052 +15.5%
 2022   3,053 -18.5%    937 -10.9%
 2023   2,814  -7.8%    758 -19.1%
 2024   2,386 -15.2%    636 -16.1%
Prowler(s)
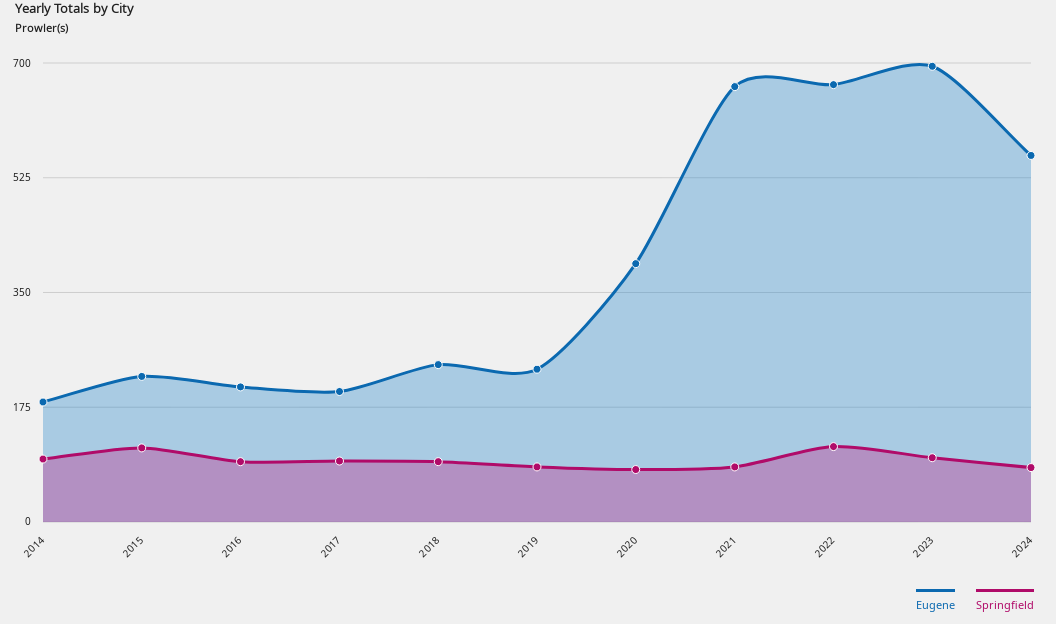
 Year   Eugene      Springfield
------ ----------- -------------
 2014   183          96
 2015   222 +21.3%  113 +17.7%
 2016   206  -7.2%   92 -18.6%
 2017   199  -3.4%   93  +1.1%
 2018   240 +20.6%   92  -1.1%
 2019   233  -2.9%   84  -8.7%
 2020   394 +69.1%   80  -4.8%
 2021   664 +68.5%   84  +5.0%
 2022   667  +0.5%  115 +36.9%
 2023   695  +4.2%   98 -14.8%
 2024   559 -19.6%   83 -15.3%
Illegal Burning

 Year   Eugene        Springfield
------ ------------- -------------
 2014      88          8
 2015     110 +25.0%  11  +37.5%
 2016      91 -17.3%   9  -18.2%
 2017     139 +52.7%   5  -44.4%
 2018     156 +12.2%   7  +40.0%
 2019     247 +58.3%  12  +71.4%
 2020     482 +95.1%  21  +75.0%
 2021     443  -8.1%  14  -33.3%
 2022     626 +41.3%  39 +178.6%
 2023     876 +39.9%  50  +28.2%
 2024   1,303 +48.7%  77  +54.0%
Person Stop
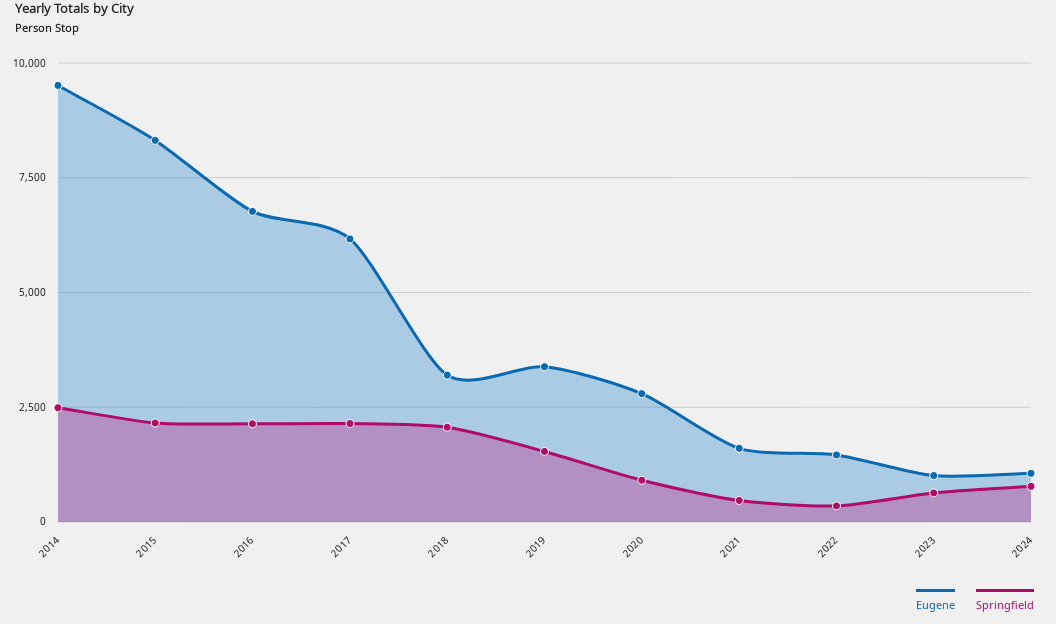
 Year   Eugene        Springfield
------ ------------- -------------
 2014   9,511         2,489
 2015   8,314 -12.6%  2,157 -13.3%
 2016   6,766 -18.6%  2,139  -0.8%
 2017   6,168  -8.8%  2,145  +0.3%
 2018   3,200 -48.1%  2,064  -3.8%
 2019   3,384  +5.8%  1,537 -25.5%
 2020   2,796 -17.4%    909 -40.9%
 2021   1,604 -42.6%    468 -48.5%
 2022   1,461  -8.9%    351 -25.0%
 2023   1,012 -30.7%    633 +80.3%
 2024   1,060  +4.7%    776 +22.6%
Illegal Camping

 Year   Eugene         Springfield
------ -------------- -------------
 2014     753          143
 2015     826   +9.7%  172 +20.3%
 2016   1,149  +39.1%  243 +41.3%
 2017   1,180   +2.7%  277 +14.0%
 2018     908  -23.1%  352 +27.1%
 2019     708  -22.0%  448 +27.3%
 2020     347  -51.0%  368 -17.9%
 2021      97  -72.0%  438 +19.0%
 2022     690 +611.3%  588 +34.2%
 2023     717   +3.9%  245 -58.3%
 2024     396  -44.8%  139 -43.3%
Year 2024 Summary (top 40 incidents, Eugene & Springfield combined)
   %       Count    Incident Type
-------  --------  ---------------
 20.24    16,701    Traffic Stop
  9.47     7,815    Criminal Trespass
  8.99     7,420    Dispute
  3.66     3,022    Disorderly Subject
  3.51     2,898    Suspicious Condition(s)
  3.44     2,835    Theft
  2.29     1,893    Traffic Hazard
  2.23     1,836    Person Stop
  1.84     1,519    Warrant Service
  1.67     1,380    Illegal Burning
  1.66     1,371    Burglary
  1.60     1,320    Alarm
  1.60     1,316    Suspicious Subject(s)
  1.53     1,266    Motor Vehicle Unknown
  1.46     1,207    Criminal Mischief
  1.32     1,093    Driving While Suspended
  1.32     1,091    Disabled Vehicle(s)
  1.22     1,009    Abandoned Vehicle
  1.21     1,000    Theft from Vehicle
  1.18       973    Loud Noise
  1.16       957    Unauthorized Use of Vehicle
  1.14       942    Assist Outside Agency
  1.03       853    Hit & Run
  1.00       824    Found Property
  0.94       773    Reckless Driving
  0.94       773    Unknown Problem
  0.89       731    Shoplifter(s)
  0.88       725    ATL Drunk Driver
  0.86       712    Assault
  0.80       664    Dog(s) at Large
  0.78       645    Motor Vehicle No Injury
  0.78       642    Prowler(s)
  0.72       595    Missing Person(s)
  0.65       535    Illegal Camping
  0.58       481    Suspicious Vehicle(s)
  0.54       447    Subpoena Service
  0.49       408    Shot(s) Fired
  0.45       370    Disorderly Juvenile(s)
  0.45       369    DUII
  0.40       327    Subject Screaming

