Data Vizualisations
83 readers
1 users here now
Post self-made data visualizations of any kind here!
founded 2 years ago
MODERATORS
1
2
3
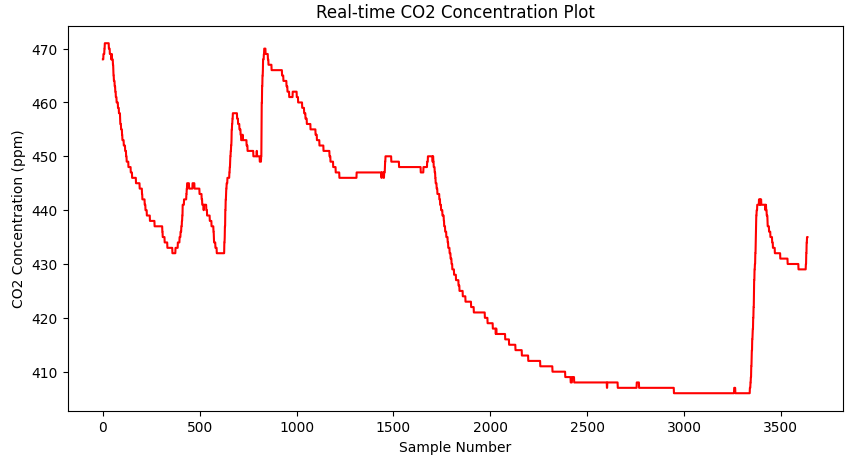
I bought a cheap Chinese manufactured CO2 sensor (RS485) with basically no documentation. It took a while, but I've finally got it reading. 0 to about 1700 was me continuing to work, then I left the room and did some gardening. I came back into the room at about 3400.
4
This is an approach I've been using since last November to put Biden's polling in a historical context. I'm using the Gallup approval rating dataset because its the longest, deepest single source dataset where the same question "Do you approve or disapprove of the way [current president's name] is handling his job as president?". Its been going on since the 40's, but has remained extremly predictive of the next president.
Previously, I presented some results (March) in the c/Politics community where using this approach, I said that Biden had between a 5-15% of winning the election. At that time, Biden was polling higher and there was more time between now (then) and election day.
I've re-run the simulation with updated numbers and am presenting them here.
First, get the mean and standard deviation of how approval ratings for past presidents have typically changed leading up to an election based a 30 day window around the current date. I then compare them to a 30 day window at election day, and get back a distribution of shifts: the typical range over which a presidents approval might change between now and the election

Next, I calculate a mean and standard deviation of approval ratings for incumbent Presidents who win their second term. We kind-of have to stick with incumbent presidents, based on the nature of the data. There really is no way to ask the Gallup pole question of non-sitting presidents or candidates.

Using these two distributions, I take a sample from the 'shift' distribution, and add it to Biden's current polling.

I then calculate the probability this new polling value would have come from the "Incumbent presidents who won election" distribution, effectively giving us the probablity, that based on extant polling, Biden can get into an approval range not-disimilar to Presidents who won re-election. Based on this approach, I'm getting an average probability of Biden winning the election at around half a percent. This is down substantially from March, where I had him at at between 5-15% probability of winning. At that time, he was both polling better, and there was more time between March and the election for him to improve.

Using this approach, a Biden victory is currently standing at between a 5 and 6 sigma event. To put it into context, last years historic rate of ice-melting in the arctic was also a five sigma event.
Bonus figure:
The distribution of Presidential polling for sitting presidents who did not win re-election:

5
11
New Nate Silver predictions are out as of today. Figures reproduced here for those who lack access (all using data provided by Nate Silver)
(self.data_vizualisations)
So I'm going to try and stay true to Nate's blog-post, but I see his predictions as too important to be pay-walled (especially consider how 538 basically isn't 538 any more since they don't use Nate's model). All of the figures in this post are my own and made using Nate's data and were made in R using ggplot. Just simple reproductions for the purposes of discussion. I didn't do all of them, just the big headline figures.
If you are in Dark Mode (as you should be) you may have to right click the figures and look at them in a separate tab.
Figure 1: Who is ahead in the polls.

Figure 2: Who is ahead in the polls (inset to recent weeks).

Table 1: State and national polling.

Table 2: Who is favored to win the Presidency?

Figure 3: How each candidate's chance of wining has changed.

Figure 4: Probability of Winning Presidential Election.

Keeping everything editorial out of the post. These are basic reproductions of Nate Silvers recent post using data he provided, to support having a discussion.
6
Differential polling error is calculated for the 2020 election as the relative difference in polling error for two candidates (Biden and Trump).
Relative error is calculated as (observed−expected)/observed, where the “observed” value represents actual election results, and the “expected” value denotes the predicted results from polls. Differential polling error is actuated as the relative error for candidate Trump minus the relative error for candidate Biden.
This statistics combines the relative polling under and over performance for each candidate. For example, in the state of Utah, if Joe Biden is under-performs his polls by 4% (-4% relative error), and Trump out-performs his polls by 8% (8% relative error), the differential polling error for this state would be (8%) - (-4%), or 12%, meaning that for this state, candidate Trump had a 12% advantage relative to polling.
I omitted 3 voting states or districts for this analysis: Hawaii, Alaska, and District of Columbia.
Hawaii and Alaska would have made the state by state visualization tiny, and made a not very attractive map. The District of Columbia can be considered an outlier in this study in that Trump signficantly under-performed his polling there (but his polling in DC was incredibly low). Trump was polling at around 12% in DC prior to election day, and gathered around 5% of the vote on election day. His relative performance would be about 120%, which would have thrown the color scheme way out of wack.

7
Polling performance for the 2020 election between Joe Biden and Donald Trump. Relative error is a metric for evaluating the accuracy of poll predictions relative to actual voting outcomes. Relative error is calculated as (observed−expected)/observed, where the "observed" value represents actual election results, and the "expected" value denotes the predicted results from polls. This statistic helps to identify the proportion by which polls under or overestimate support for a candidate. In this figure, a positive relative error indicates that the polls underestimated the candidate's actual support, while a negative value suggests an overestimation.

8
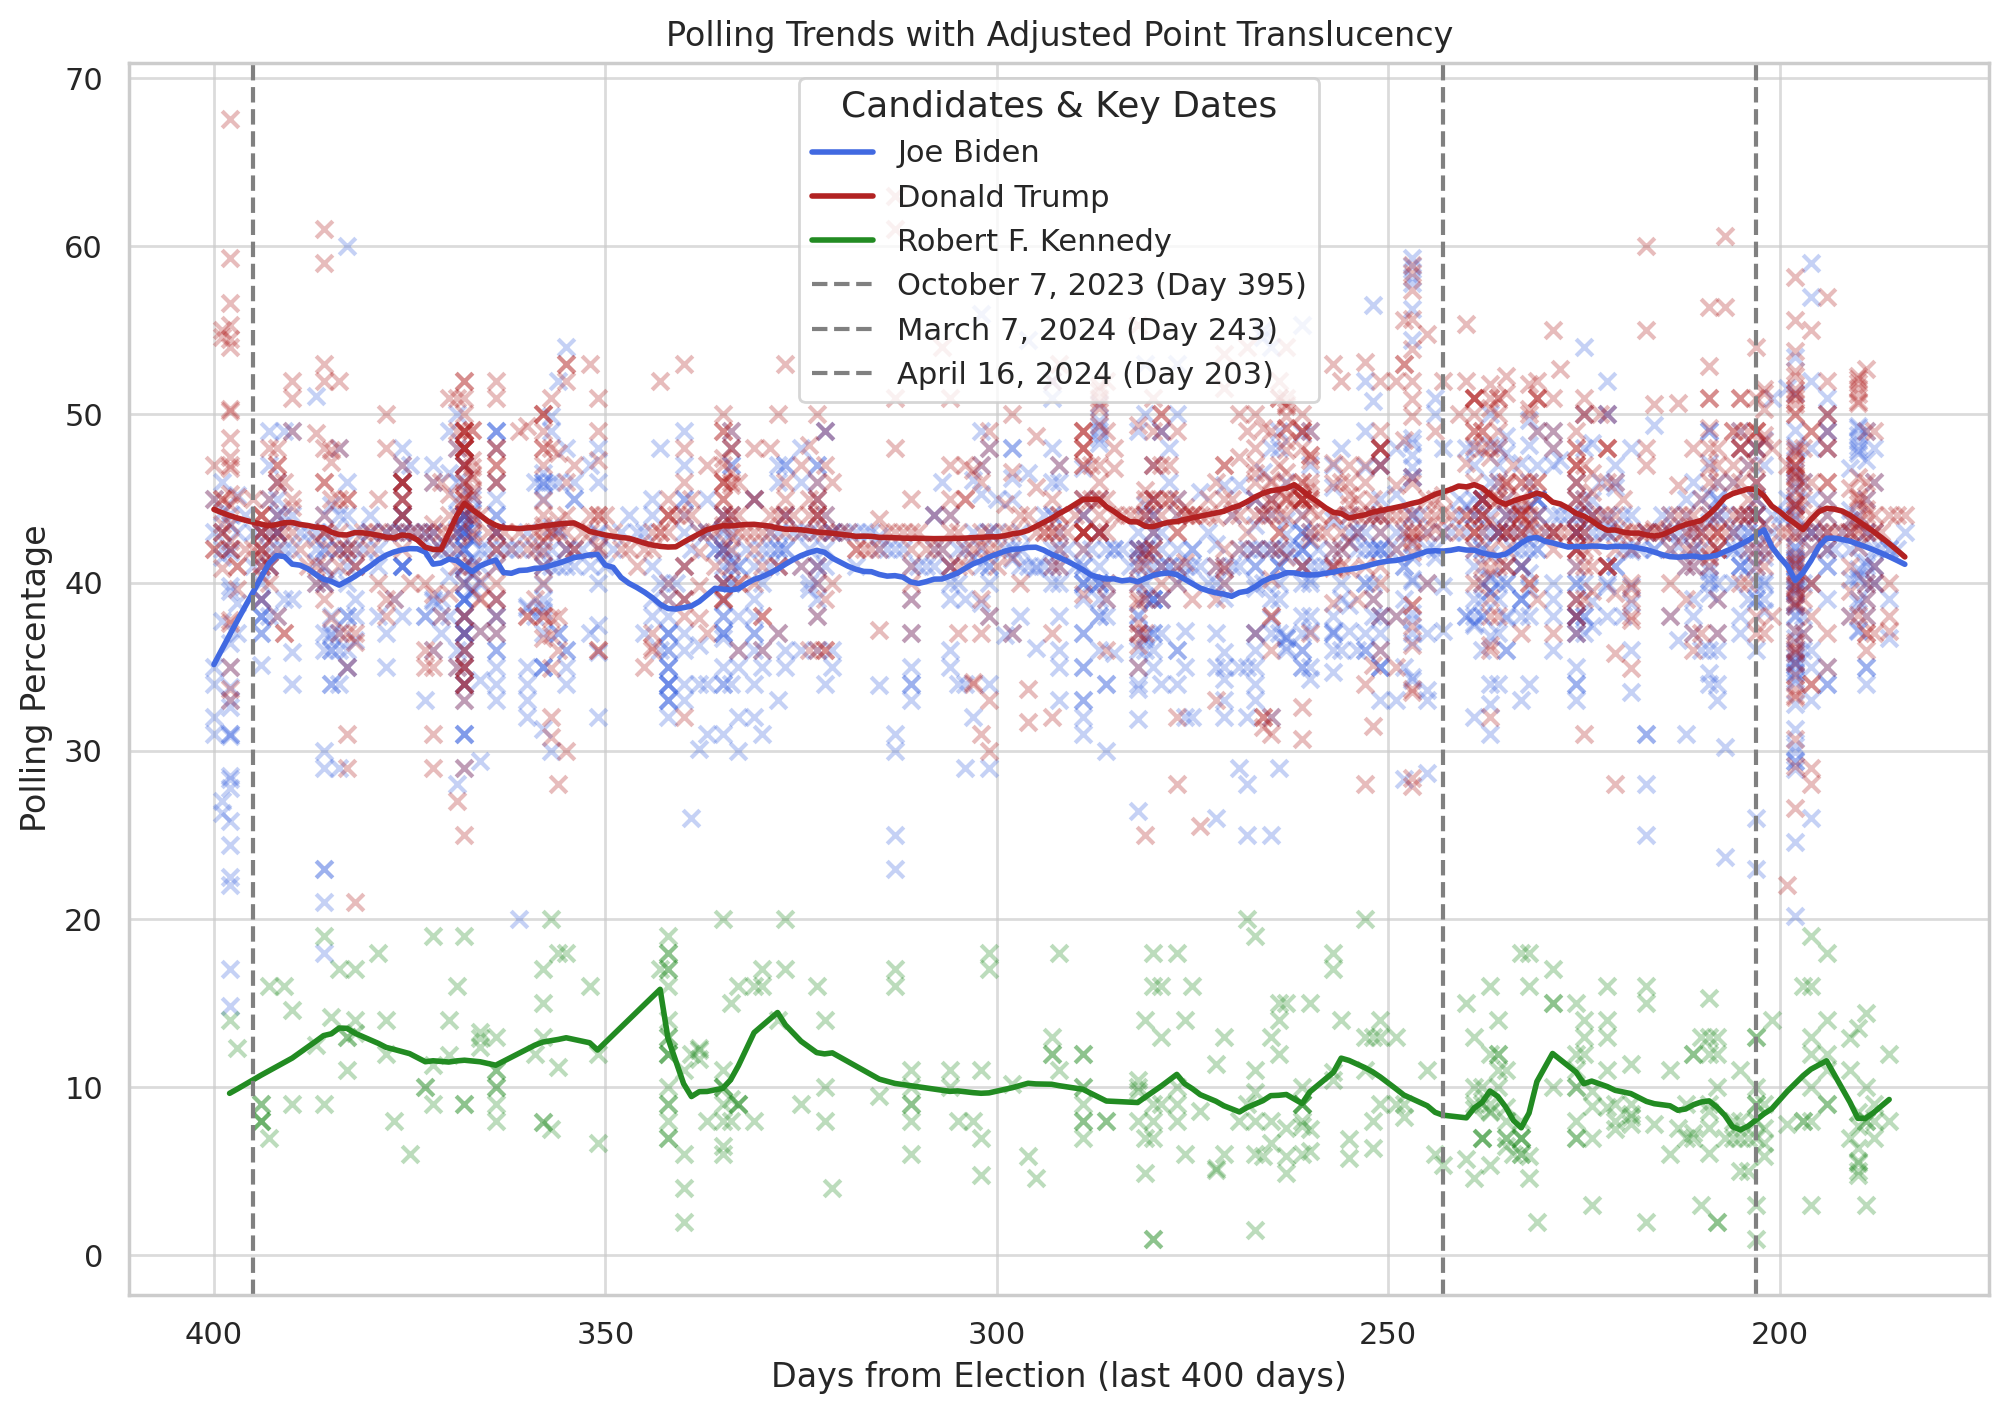
So the big news at this time would be that both DJT and Biden are declining with the most recent months polling.
Biden has effectively lost any gains he made with his strong performance with the State of the Union. It looks like he'll be sub 40 going again, where he was dipping into the high 30's around December. Keep in mind that Biden's quarterly current polling places him in as the lowest polling president ever with regards to economic performance.
President Joe Biden averaged 38.7% job approval during his recently completed 13th quarter in office, which began on Jan. 20 and ended April 19. None of the other nine presidents elected to their first term since Dwight Eisenhower had a lower 13th-quarter average than Biden.
Interestingly, Trump has not been able to make any real gains from Bidens record under-performance for an incumbent. Trump is also slipping in the polling from a stable 44% that has been fairly consistent post Presidency, to now nudging into the high 30s. This decline began around the time of the start of the ongoing hush money trial and with betting markets putting it at a ~70% probability of a guilty verdict. So the gamblers are for once not putting their money on Teflon Don, but its extremely unclear how this will effect Trumps polls nationally.
In other news, Robert "the brain worms made me do it" Kennedy has failed to catapult into relevancy since his surge in late March. Kennedy's overall polling numbers have declined with both Biden and Trumps. Its still disagreed upon whom Kennedy is drawing voters from more significantly, but its becoming clear that he'll need something big to be able to capitalize the moment into something larger. Anecdotally, Kennedy's campaign has been compared to Ross Perot's infamous 1992 run that is often attributed to the reason why George Bush Sr. lost that election.
In summary, it looks like we're in a race to the bottom among voters this election cycle. Obvious causes for this on the Biden side are his position on Israel/ Gaza, student protests, and the refusal to hold Israel accountable in any meaningful way. On the Trump side we have an ongoing criminal trial, as well as renowned puppy-killer Kristi Noem taking much of the headlines. Is there a chance that the worms in RFK Jr's brain might give him a clever idea that can catapult him into the 20-30 point range where he can represent a competitive alternative to either major party?
I'll be posting another update in around 30 days, and as polling increases frequency as we get closer to election day, I may increase this posting to around 15 days depending on the availability of data.
Cheers and happy polling!
Data: https://projects.fivethirtyeight.com/polls/president-general/2024/national/
9
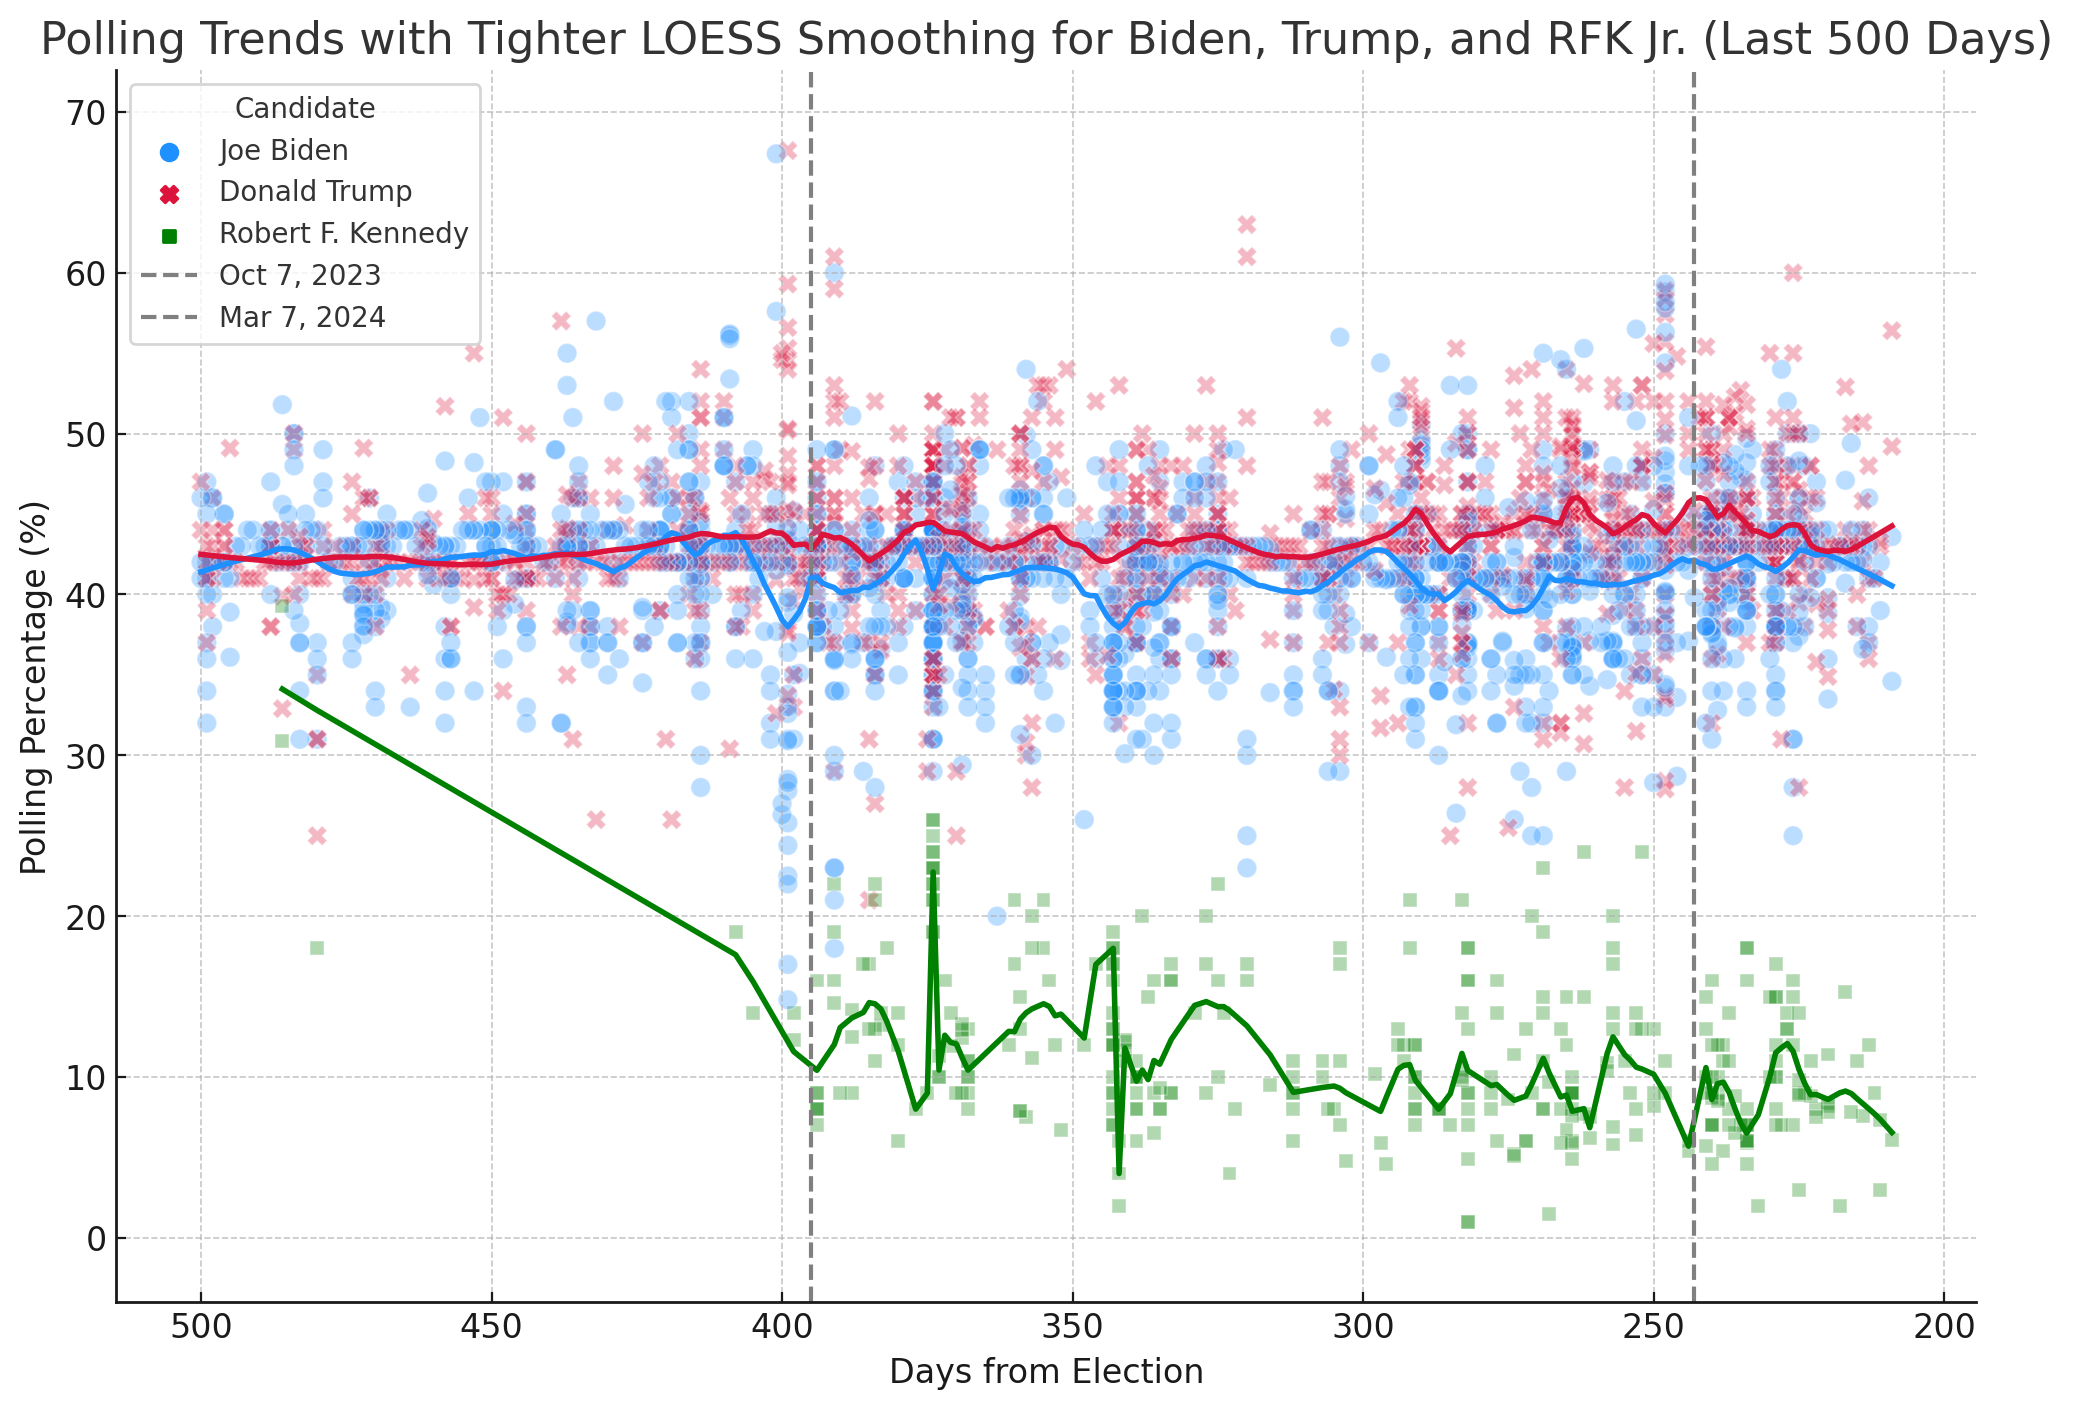
Also made one including RFK jr. since I think at this point his polling is starting to warrant his inclusion. The vertical lines are for the last two major political events (October 7th, and the state of the Union). Let me know what you think or if there are any changes you would like to see. I've been making this figure monthly for the previous 4 months. I'm planning on continue to make it and post it till we get to the big game.