Kryesh

joined 1 year ago
[–] Kryesh 1 points 1 month ago

I'm currently using the fluentbit http output plugin, fluentbit can act as an otel collector with an input plugin which could then be routed to the http output plugin. Long term I'll probably look at adding it but there's other features that take priority in the app itself such as scheduled searching and notifications/alerting

[–] Kryesh 2 points 1 month ago* (last edited 1 month ago) (1 children)

Applications like metrics because they're good for doing statistics so you can figure out things like "is this endpoint slow" or "how much traffic is there"

Security teams like logs because they answer questions like "who logged in to this host between these times?" Or "when did we receive a weird looking http request", basically any time you want to find specific details about a single event logs are typically better; and threat hunting does a lot of analysis on specific one time events.

Logs are also helpful when troubleshooting, metrics can tell you there's a problem but in my experience you'll often need logs to actually find out what the problem is so you can fix it.

[–] Kryesh 1 points 1 month ago (2 children)

Thanks! definitely aiming for a stupid easy installation/management for the app itself; but in my experience getting a wide range of supported log sources is no small feat. I've been using fluentbit to handle collection from different sources and using the following has been working well for me:

  • docker 'journald' log driver
  • fluentbit 'systemd' input
  • fluentbit 'http' output like the one in the readme

with that setup you can search for container logs by name which works great with compose:

or process logs from an nginx container like this to see traffic from external hosts:

I'll add a more complete example to the docs, but if you look in the repo there's a complete example for receiving and ingesting syslog that you can run with just "docker compose up"

[–] Kryesh 2 points 1 month ago* (last edited 1 month ago)

Oh I wasn't using it as a full recursive resolver - just reading the resolv.conf set by docker and sending requests

[–] Kryesh 3 points 1 month ago (2 children)

More good points, thank you! for trust-dns-resolver that's a relic from a previous iteration that had polling external sources and needed to resolve dns records. Since i haven't gotten around to re-implementing that feature it should be removed. As for why - I actually needed to bring my own resolver since the docker container is a scratch image containing only some base directories and the server binary so there isn't any OS etc to lean on for things like dns; means that the whole image is ~15.5MB which is nice and negates a whole class of vulnerabilities.

Understood that your actual point is to document this stuff and not answer the trivia question though

[–] Kryesh 10 points 1 month ago (4 children)

Thanks! it's definitely got a way to go before it's remotely competitive with any of the enterprise solutions out there, but you make a good point about having comparisons so I'll look at adding it.

I'm basically building it to have a KQL/LogScale/Splunk/Sumologic style search experience while being trivial to deploy (relative to others at least...) since I miss having that kind of search tooling when not at work; but I don't want to pay for or maintain that kind of thing in a lab context. It creates a Tantivy index per day for log storage (with scoring and postings disabled for space savings).

In the end my main goal of the project was as a vehicle to get better at programming with, and if I get a tool I can use for my lab then that's great too lol.

132
submitted 1 month ago* (last edited 1 month ago) by Kryesh to c/selfhosted
 

Hi everyone, I've been building my own log search server because I wasn't satisfied with any of the alternatives out there and wanted a project to learn rust with. It still needs a ton of work but wanted to share what I've built so far.

The repo is up here: https://codeberg.org/Kryesh/crystalline

and i've started putting together some documentation here: https://kryesh.codeberg.page/crystalline/

There's a lot of features I plan to add to it but I'm curious to hear what people think and if there's anything you'd like to see out of a project like this.

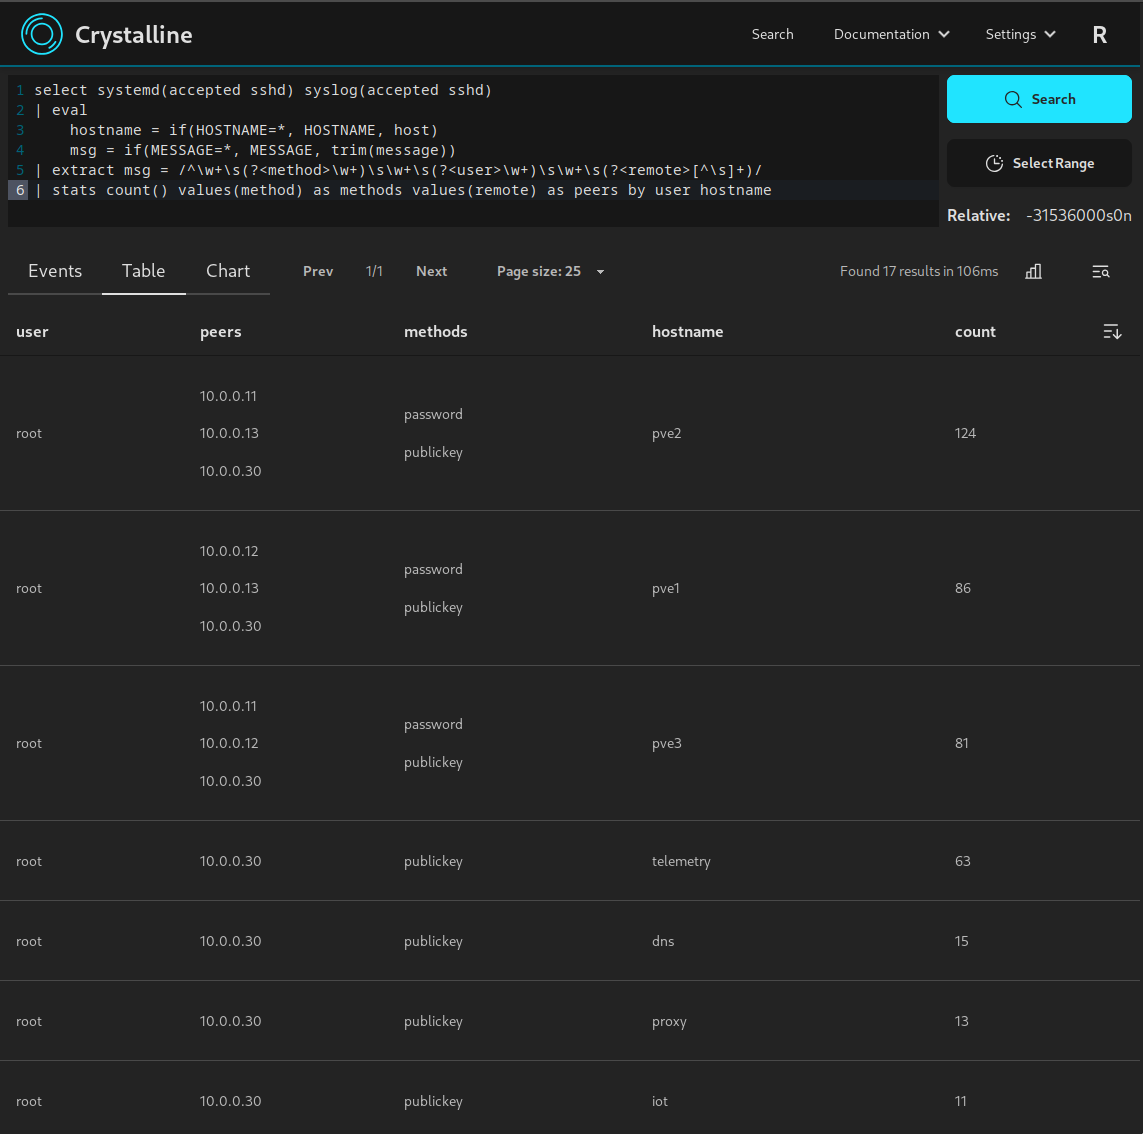
Some examples from my lab environment:

events view searching for SSH logins from systemd journals and syslog events:

counting raw event size for all indices:

performance is looking pretty decent so far, and it can be configured to not be too much of a resource hog depending on use case, some numbers from my test install:

  • raw events ingested: ~52 million
  • raw event size: ~40GB
  • on disk size: ~5.8GB

Ram usage:

  • not running searches ingesting 600MB-1GB per day it uses about 500MB of ram
  • running the ssh search examples above brings it to about 600MB of ram while the search is running
  • running last example search getting the size of all events (requires decompressing the entire event store) peaked at about 3.5GB of ram usage
[–] Kryesh 4 points 6 months ago* (last edited 6 months ago) (2 children)

So the PC connected to opnsense is running proxmox for it's OS? Create a bridge for each physical interface, then add a tagged interface to it for the one connected to opnsense; Eg, vmbr2 could have enp2s0.100 and enp9s1f0 as members. Just add .vlanid to the end of the interface name in the bridge settings in proxmox, and don't make the bridges vlan aware. If vmbr0 is vlan aware then just add vmbr0.100 instead of enp2s0.100 With that setup the server will switch packets between the vlans on enp2s0 and the other interfaces. Don't need to put any VMs on the bridges

Will add: this is using the PC like a switch, you're probably better off using an actual switch with vlan configuration instead

[–] Kryesh 16 points 1 year ago* (last edited 1 year ago) (1 children)

So first thing, an open port isn't a bad thing most of the time. And a malware infection doesn't need open ports, nor does modern malware try to open ports.

How did they check for these open ports? Did they log in the router and check? Run a scan from an external service?

The most common explanation for unknown open ports on a router in a home network will be a feature called "universal plug and play" or UPnP for short. This allows IOT devices to ask the router for a port to be opened, and by default most home routers will do just that. Devices like security cameras etc often do that so you can access the video from a phone or something. Games also sometimes use UPnP to open ports for multiplayer.

It's considered good security practice to disable UPnP as a lot of devices don't really protect the services they expose through UPnP; but that still doesn't make open ports an indication of malware.

On the subject of games, is there anyone in the house that might try to host a game server? Even something as simple as minecraft doesn't need any additional software and a Google search for how "friends can't connect to Minecraft game" will show instructions on how to set up port forwarding etc.

[–] Kryesh 1 points 1 year ago

It's a downgrade in speed, but not a massive one. the CL16 or CL18 refers to cas latency which (greatly simplified) - is the number of clock cycles to perform certain operations, so lower is better assuming you're comparing kits with the same frequency. Ryzen chips really like low latency memory, but the difference in performance is only a few percent even with larger differences than the one you're looking at.