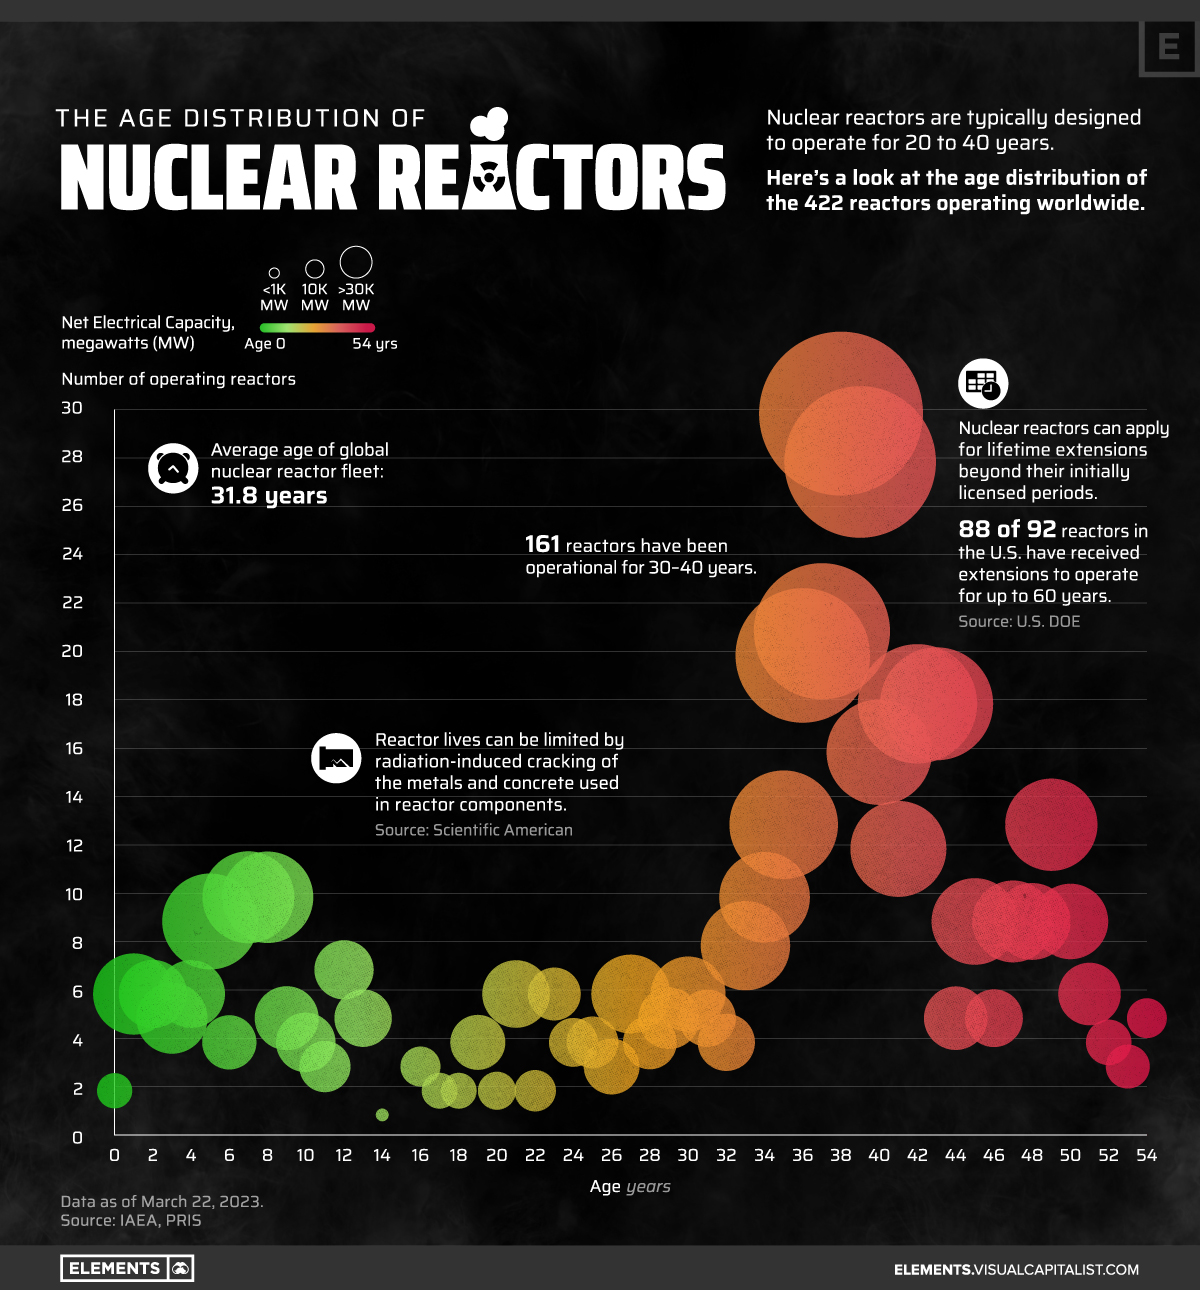
It is worth noting that this chart appears to only show commerical power plants. It's potentially worthwhile to also discuss the ~80 reactors with 0-50 years of core life in the USN alone (~50 from 0-34 [fast attack], 18 from 25-41 [boomer], and 11 from 0-50 years [CVN] in use).
this post was submitted on 30 Jun 2023
6 points (100.0% liked)
Visualization
140 readers
9 users here now
For topics related to visualization of data (infographics). That includes: graphs, charts, maps, etc.
Rules:
- Always link to the original source of the infographic/visualization
founded 2 years ago
MODERATORS

