this post was submitted on 30 Jun 2023
6 points (100.0% liked)
Visualization
140 readers
9 users here now
For topics related to visualization of data (infographics). That includes: graphs, charts, maps, etc.
Rules:
- Always link to the original source of the infographic/visualization
founded 2 years ago
MODERATORS
you are viewing a single comment's thread
view the rest of the comments
view the rest of the comments


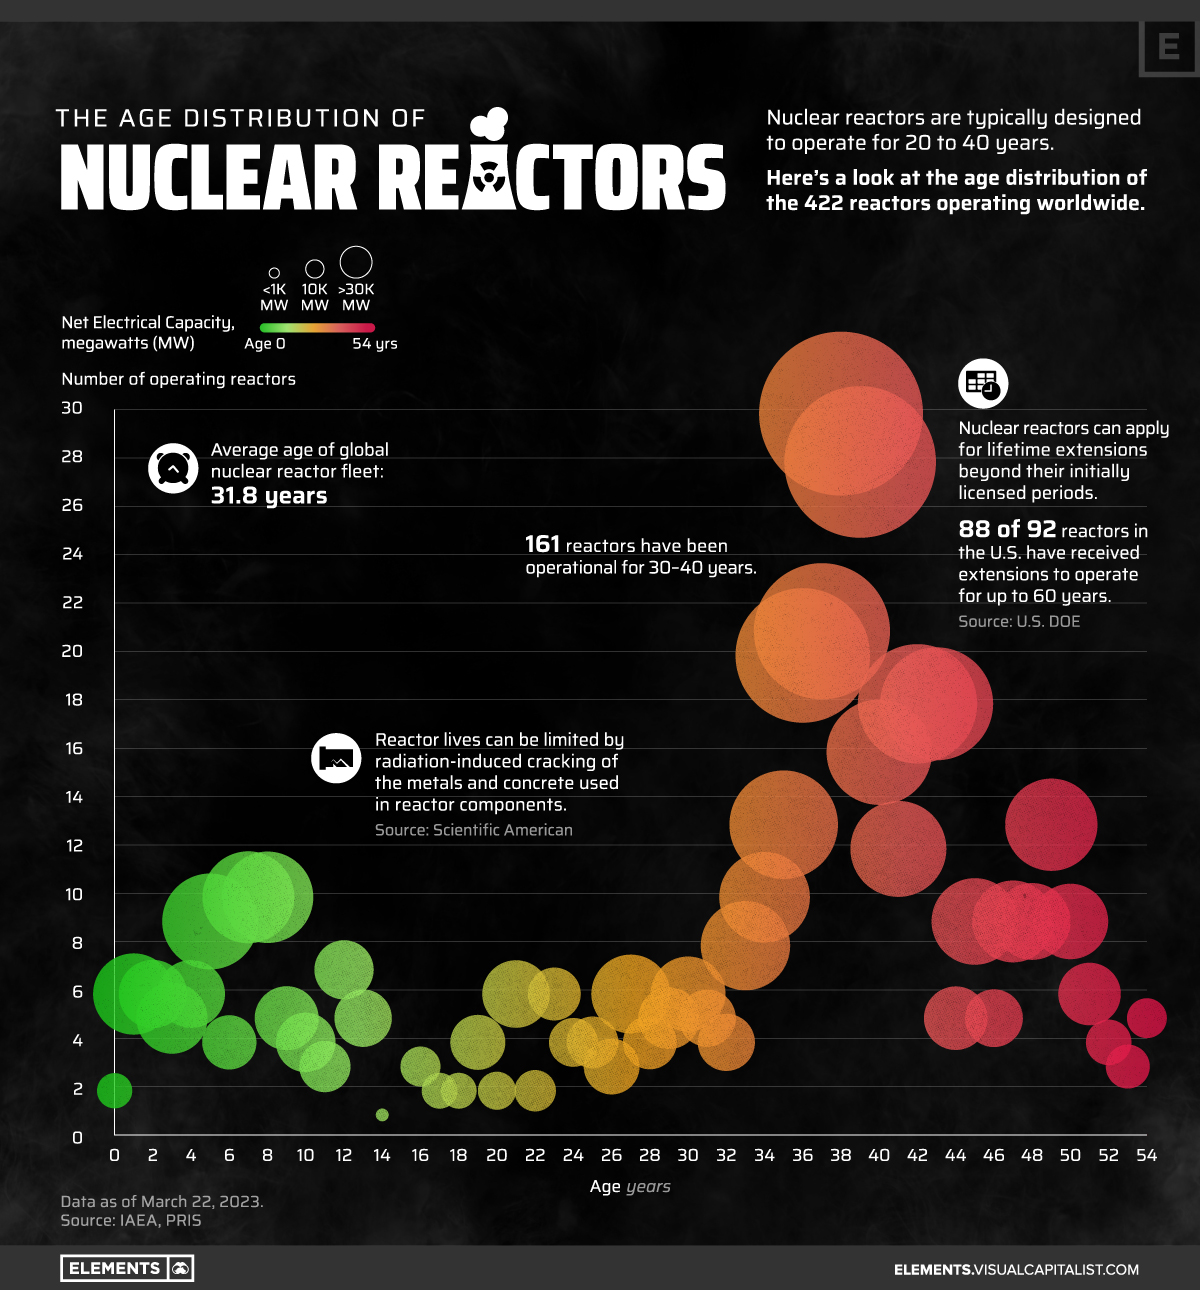
It is worth noting that this chart appears to only show commerical power plants. It's potentially worthwhile to also discuss the ~80 reactors with 0-50 years of core life in the USN alone (~50 from 0-34 [fast attack], 18 from 25-41 [boomer], and 11 from 0-50 years [CVN] in use).