Hi everyone, I host a server with few services running for my family and friends. The server freezes sometimes. Where the services stop responding. If I try to ssh into the server, it takes a lot of time (3 to 5 mins) for it to connect. After being connected, every letter I type takes 2 to 3 mins to appear on screen.
Seems like the server is overloaded with tasks. But I am not sure what load it is running. I have netdata installed. I could pull up following screenshots for insights.
Can someone please help me in troubleshooting the issue?
I have tried testing stress testing my RAM and CPU, and they were fine. But I would start troubleshooting from scratch if you have recommendations for testings softwares.
Please also let me know if there is anything I can pull from netdata to help in trouble shooting.
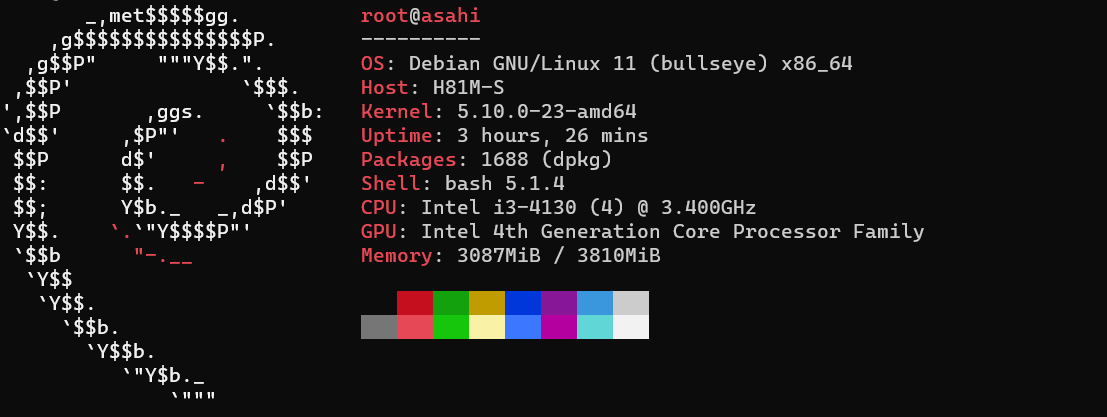
System Specification:

System RAM

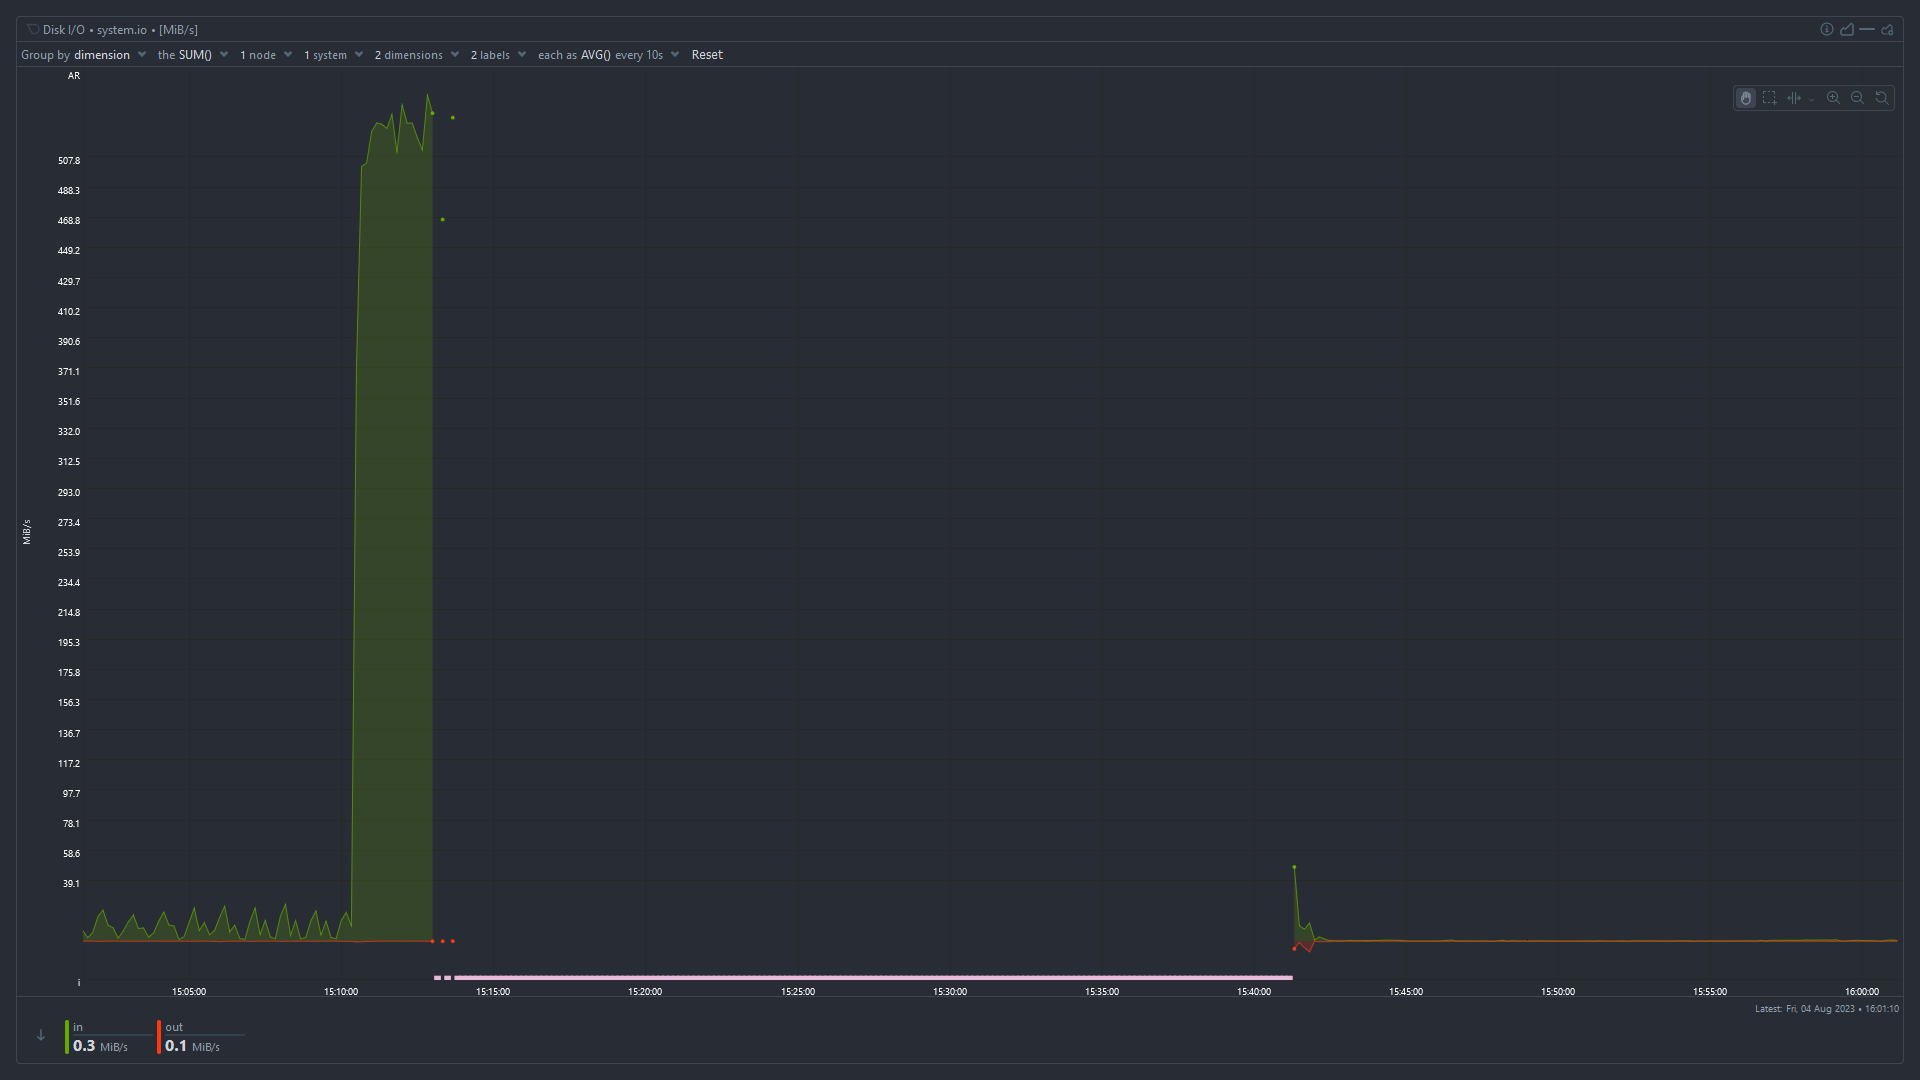
Disk I/O
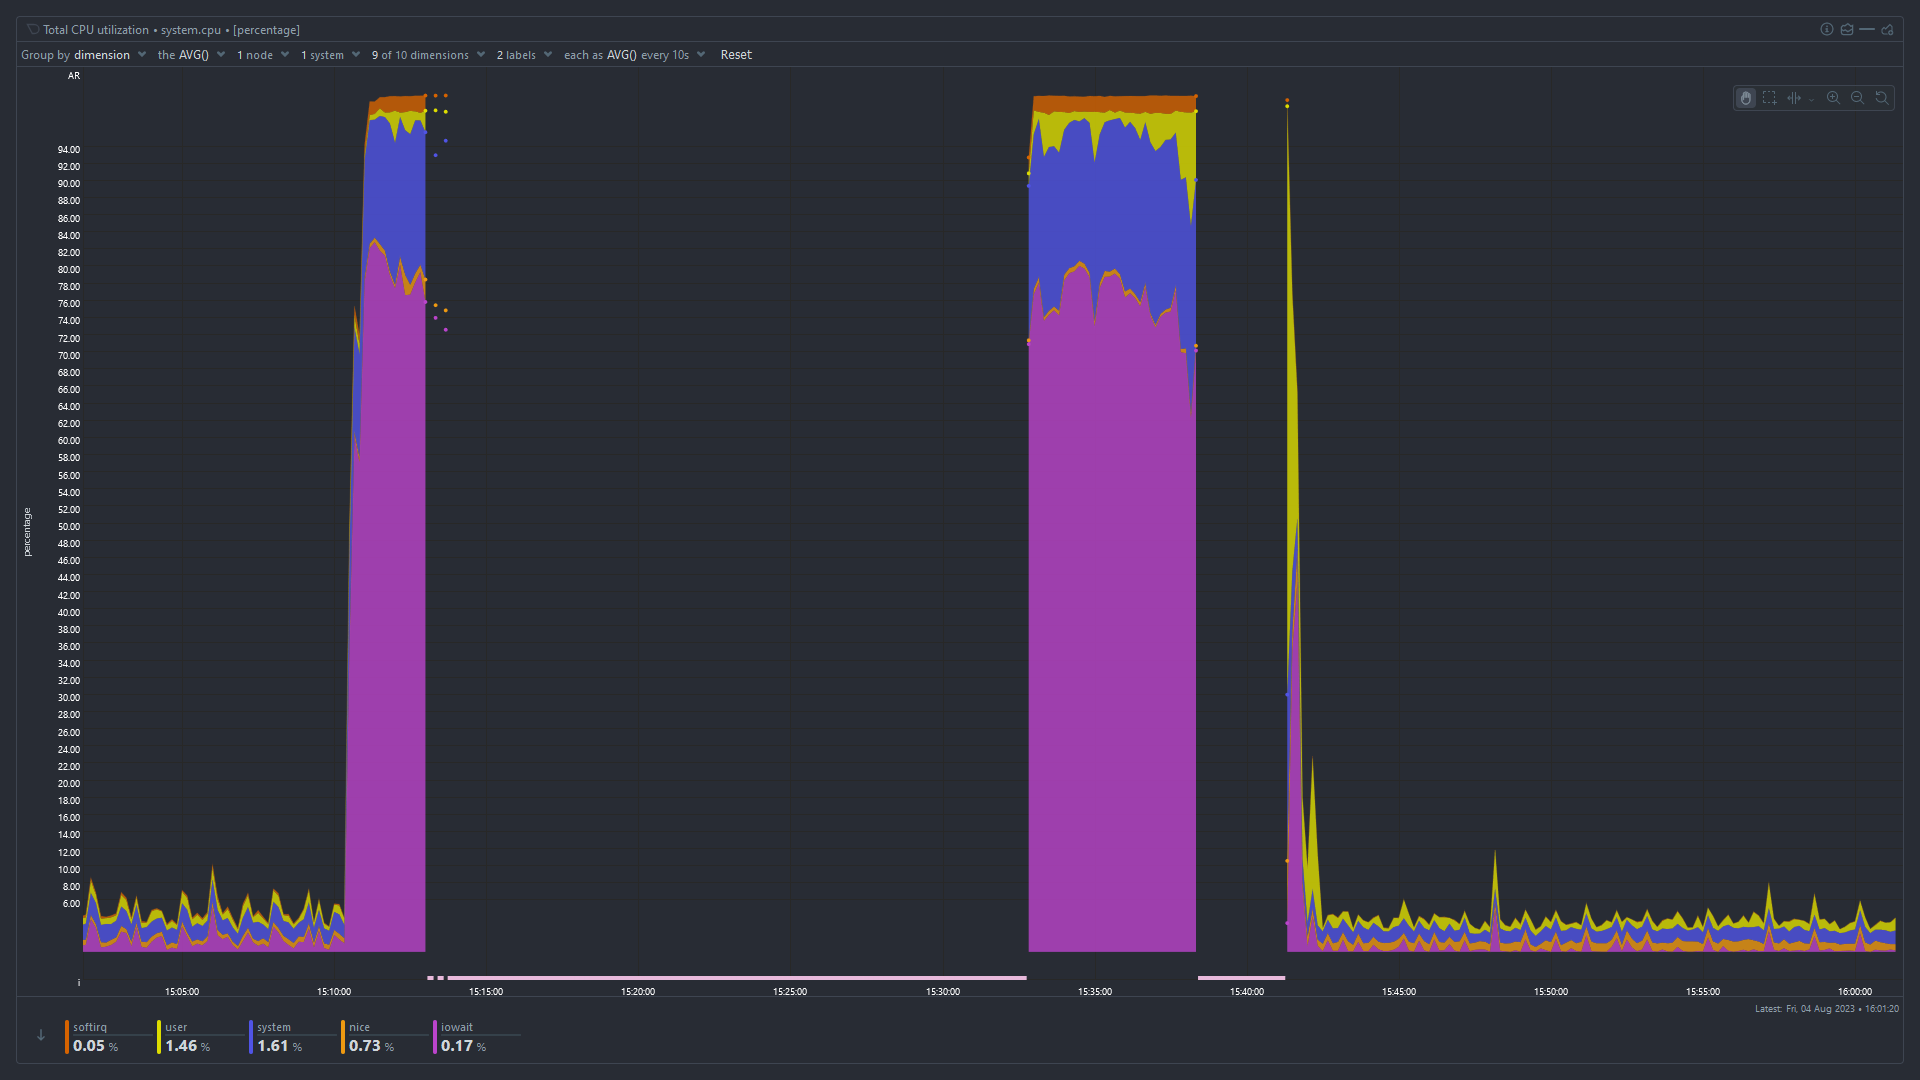
Total CPU Utilization
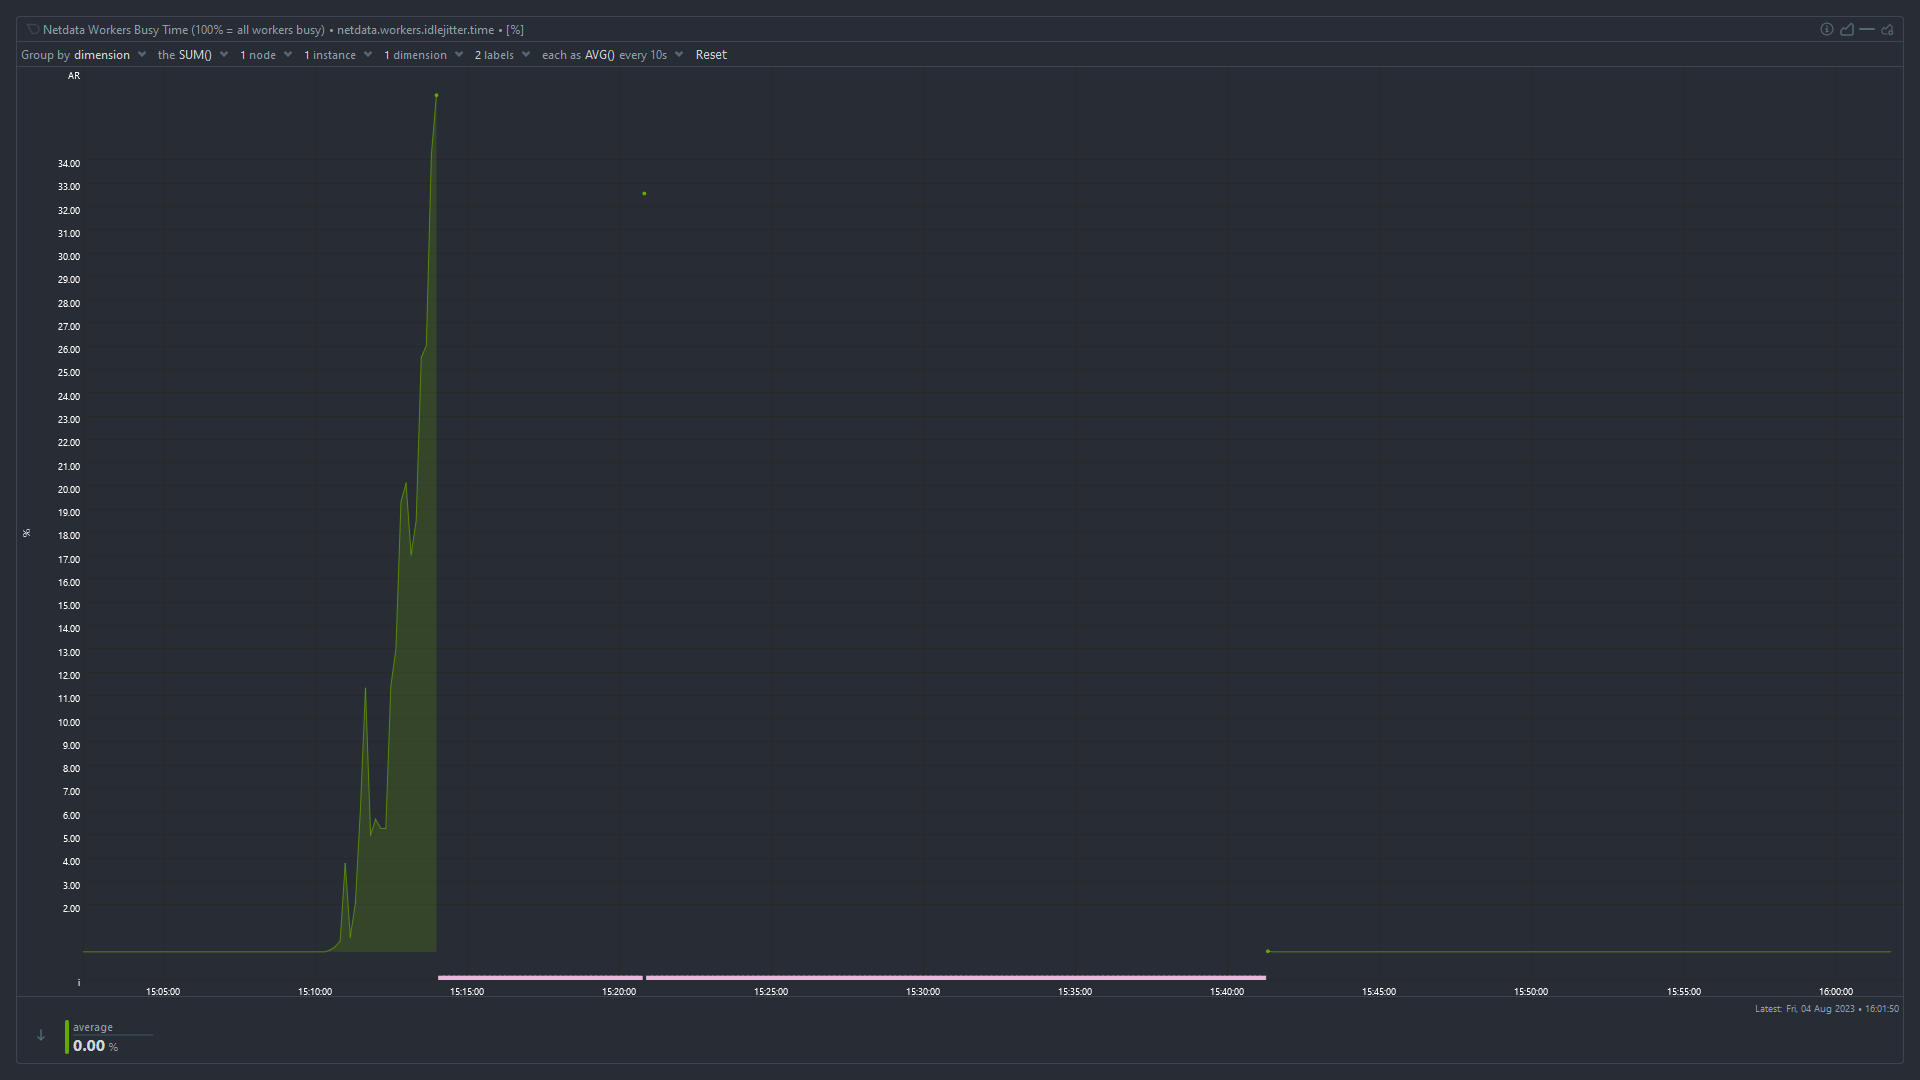
Idle Jitter