this post was submitted on 19 Jun 2024
12 points (92.9% liked)

Map Enthusiasts

2976 readers
2 users here now

For the map enthused!

Rules:

founded 1 year ago
MODERATORS
 

Source

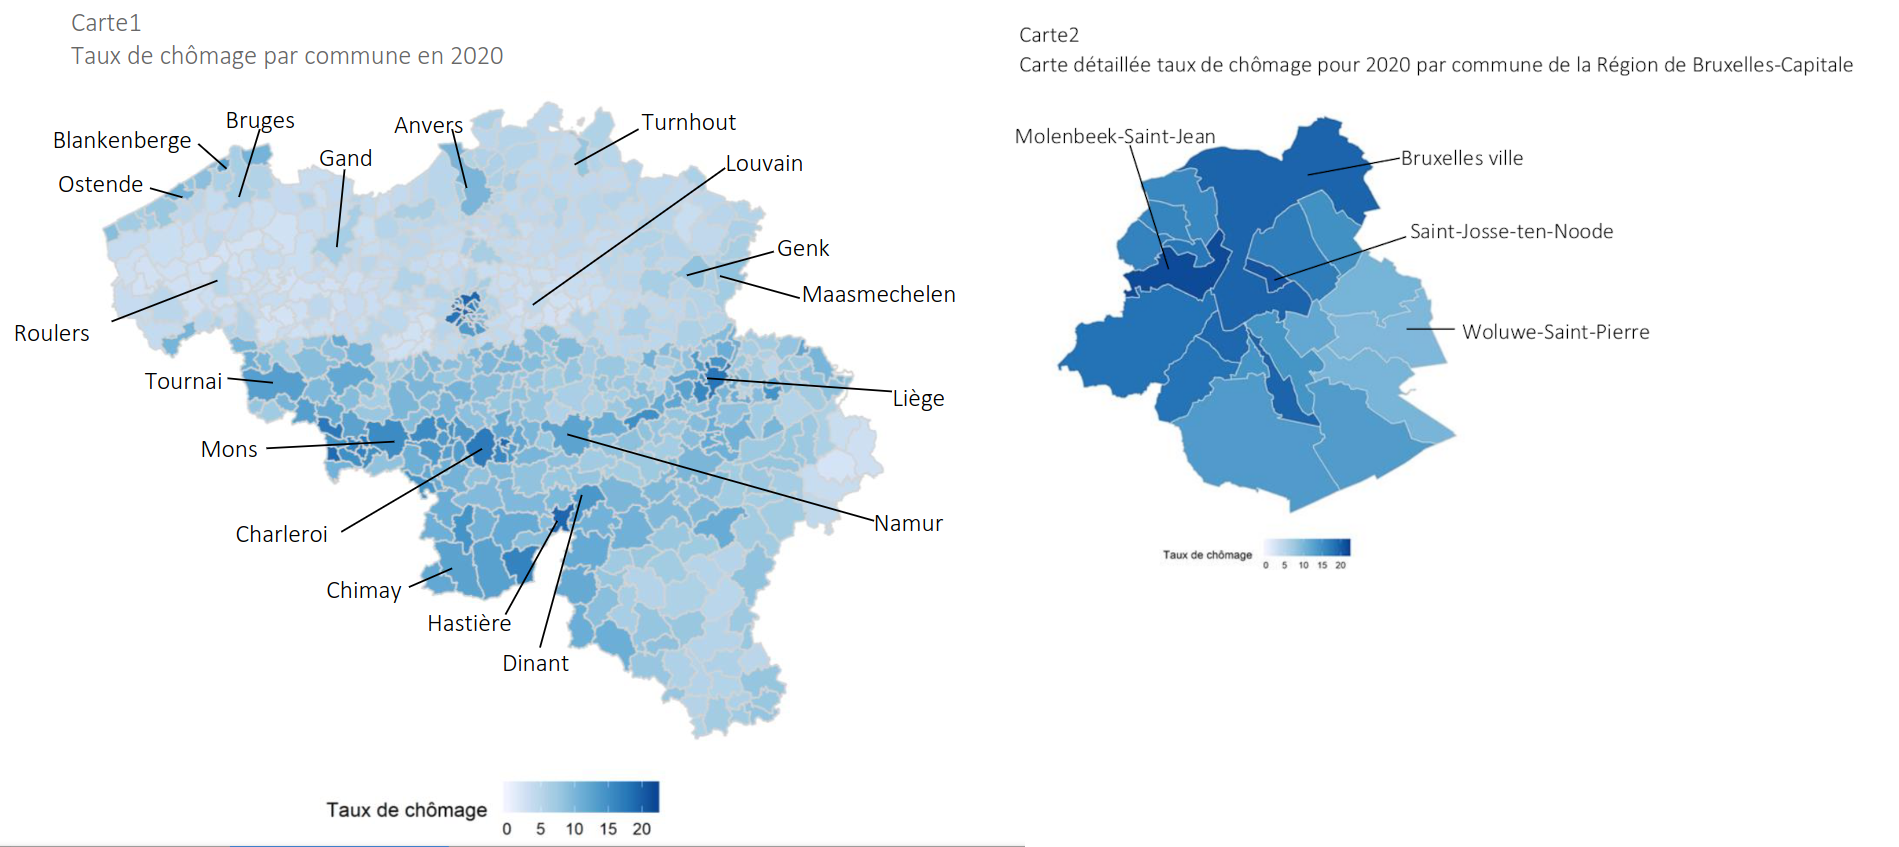
In the map it can be clearly seen that the unemployment is higher in Wallonia than in Flanders. This is largely due to the fact that Wallonia has historically relied on its heavy industry, such as steel and coal, which has moved abroad the last decades. In fact, the Sambre and Meuse valley which was the industrial heartland in Belgium thanks to its coal resources, can be clearly seen on the map.

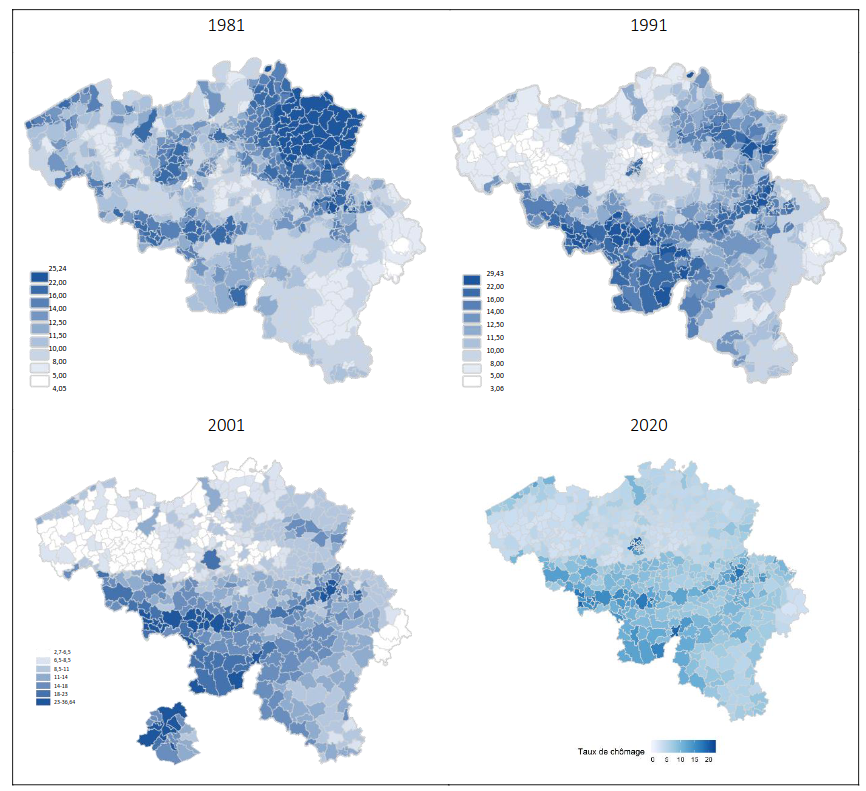
It is also interesting to see how the distribution of unemployment has changed throughout the years, as seen on these maps:

top 4 comments
sorted by: hot top controversial new old
[–] [email protected] 1 points 3 days ago* (last edited 3 days ago) (1 children)

I see some sort of “unemployment belt” in from Mons through Liège, I wonder what caused that?

[–] [email protected] 1 points 3 days ago

The area used be be a huge industrial area, which then suffered from desindustrialisation

You have similar areas in the north/east of France

[–] [email protected] 3 points 1 week ago

Limbourg evolution is impressive

[–] [email protected] 1 points 1 week ago

Wish I could see it. www.onem.be seems to be dropping my packets.