this post was submitted on 20 Jun 2024
421 points (97.9% liked)
Data is Beautiful
1625 readers
1 users here now
Be respectful
founded 8 months ago
MODERATORS
you are viewing a single comment's thread
view the rest of the comments
view the rest of the comments

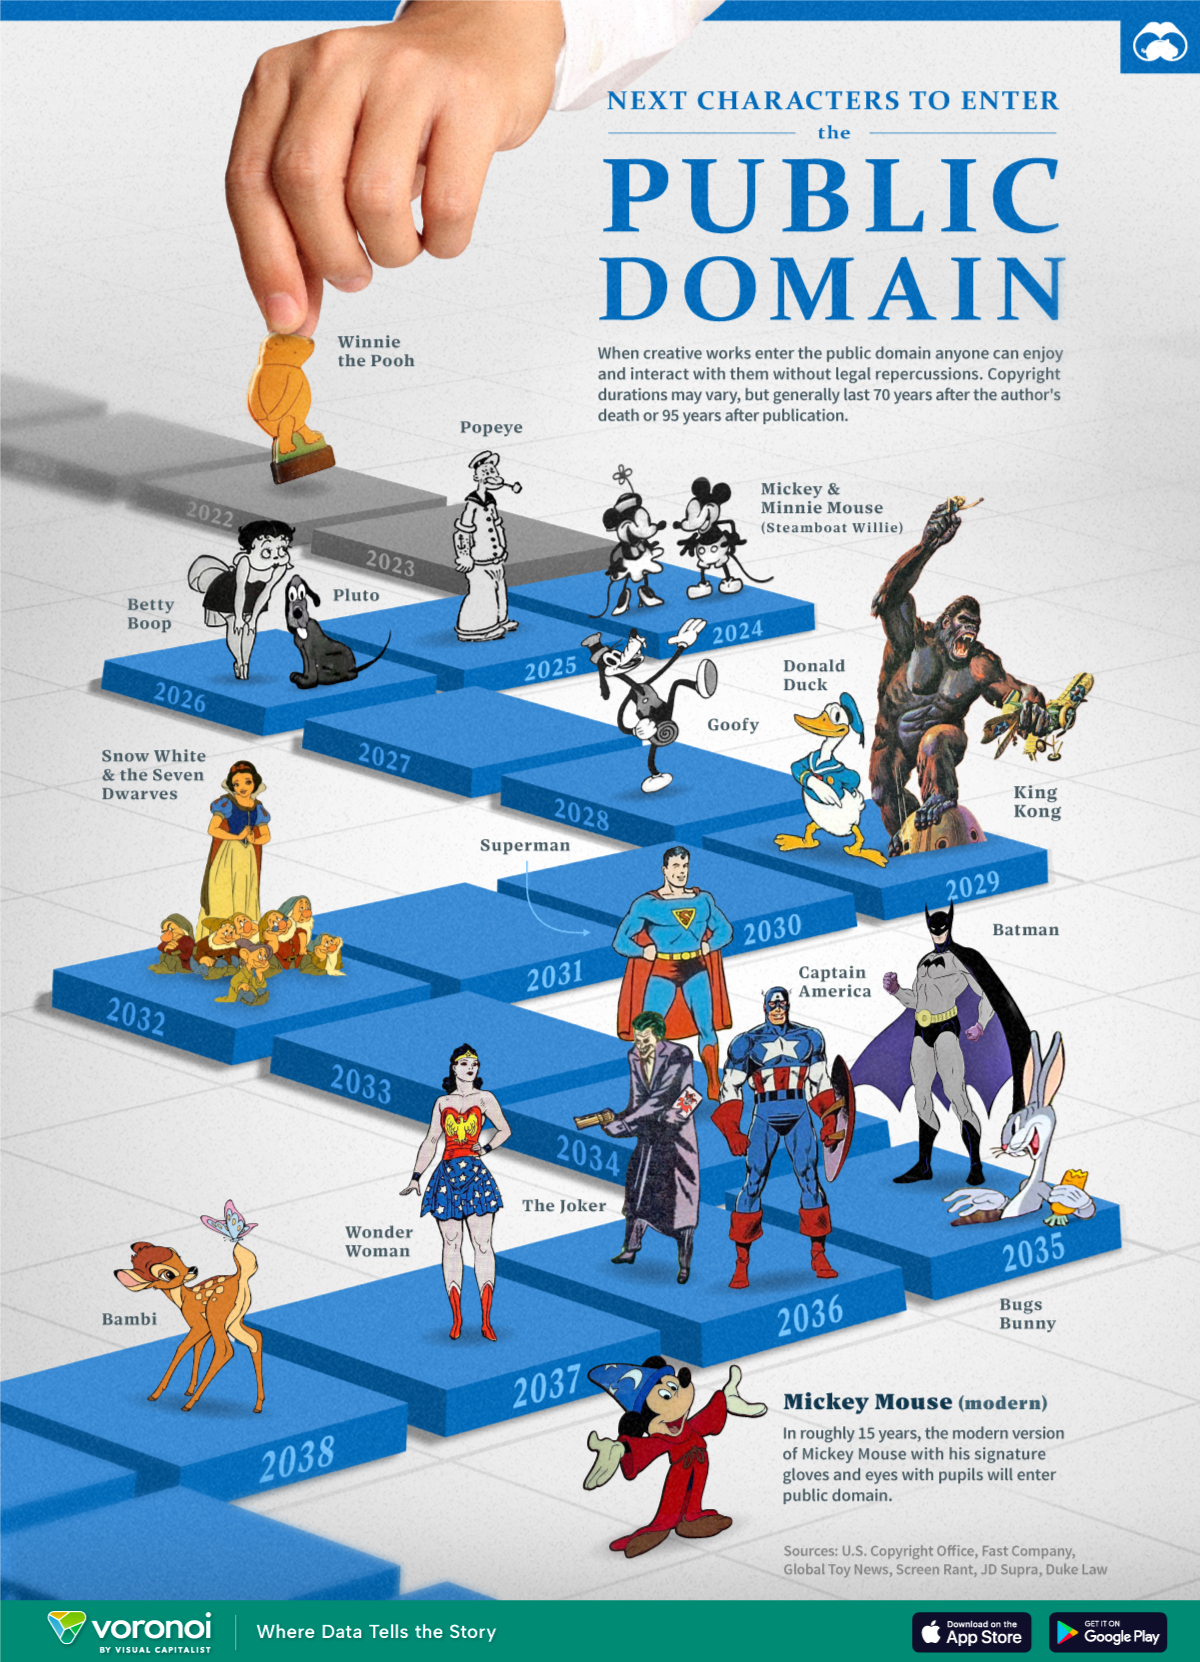
I appreciate you posting here often but this is not a data visualization. This is just a graphic with dates on it
I see it as a way of visually presenting (character, year) data points.