this post was submitted on 12 Jun 2024
428 points (79.2% liked)
US Authoritarianism
478 readers
664 users here now
Hello, I am researching American crimes against humanity. . This space so far has been most strongly for memes, and that's fine.
There's other groups and you are welcome to add to them. USAuthoritarianism Linktree
See Also, my website. USAuthoritarianism.com be advised at time of writing it is basically just a donate link
Cool People: [email protected]
founded 3 months ago
MODERATORS

you are viewing a single comment's thread
view the rest of the comments
view the rest of the comments
Is this fact/accurate??
Excluding top 1000 drops the average in half??
Definitely a reason to only ever use median instead.
Median is the middle point of the population and has its place when the range doesn't skew too much. I think a good representation of income is by percentages, as in "90% of people make $x,000 or below". This chart had dated (2010) data but its a better representation than I've found elsewhere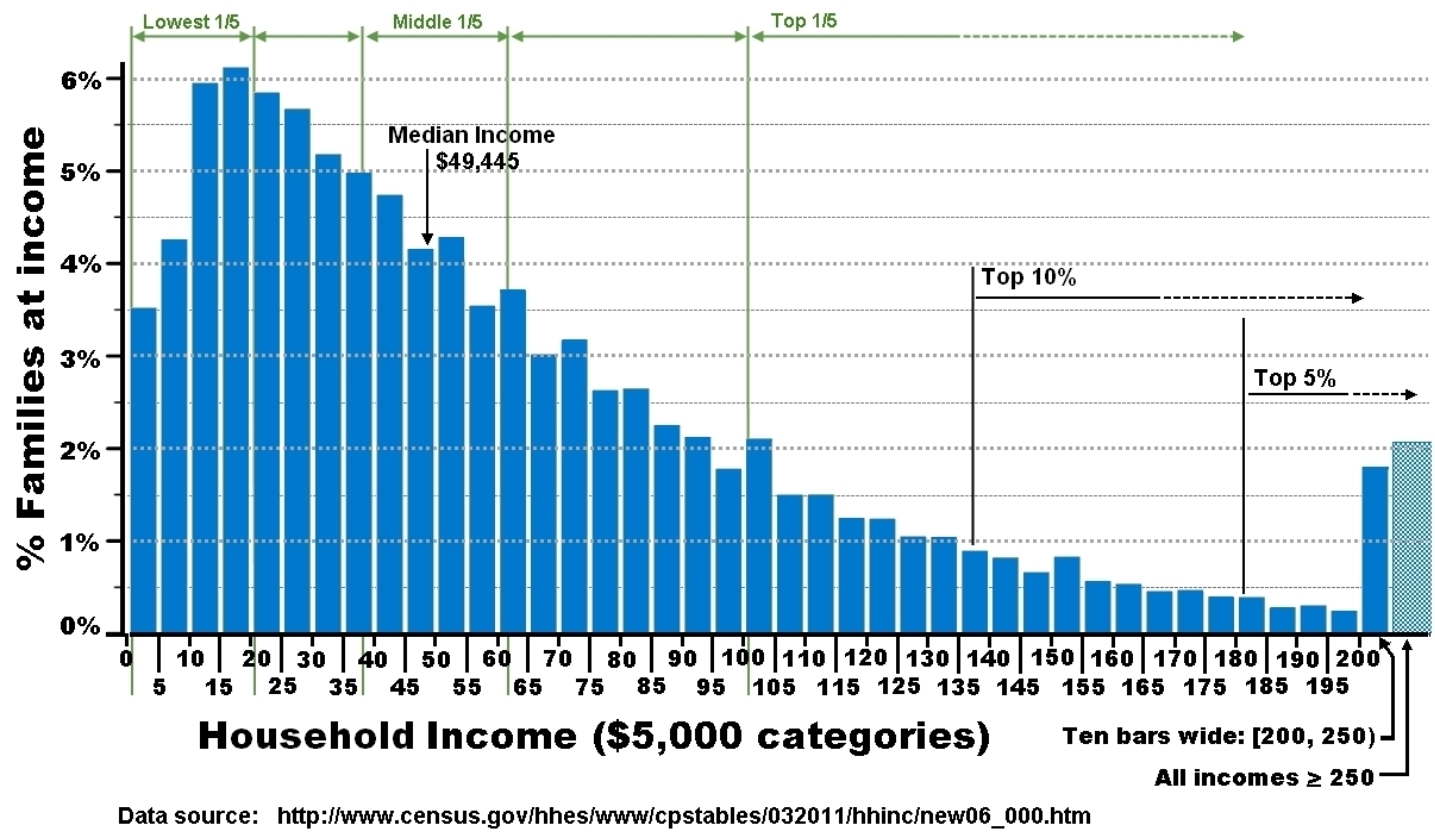
Massive skews and tails are why you use median.
Its median is tool for understanding data but it doesn't paint a complete picture and can't be representative without other context. For example, if you have a bimodal distribution, the median doesn't tell you much just how like the average doesn't tell you much. There are other examples like this.