I was looking for this exact breakdown yesterday. thank you for summarizing this, much easier to parse at a glance.
Stable Diffusion
Discuss matters related to our favourite AI Art generation technology
Also see
Other communities
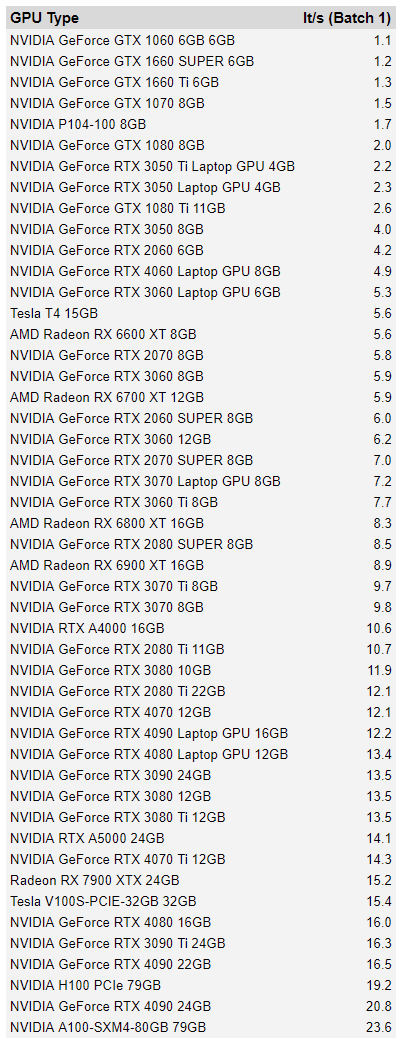
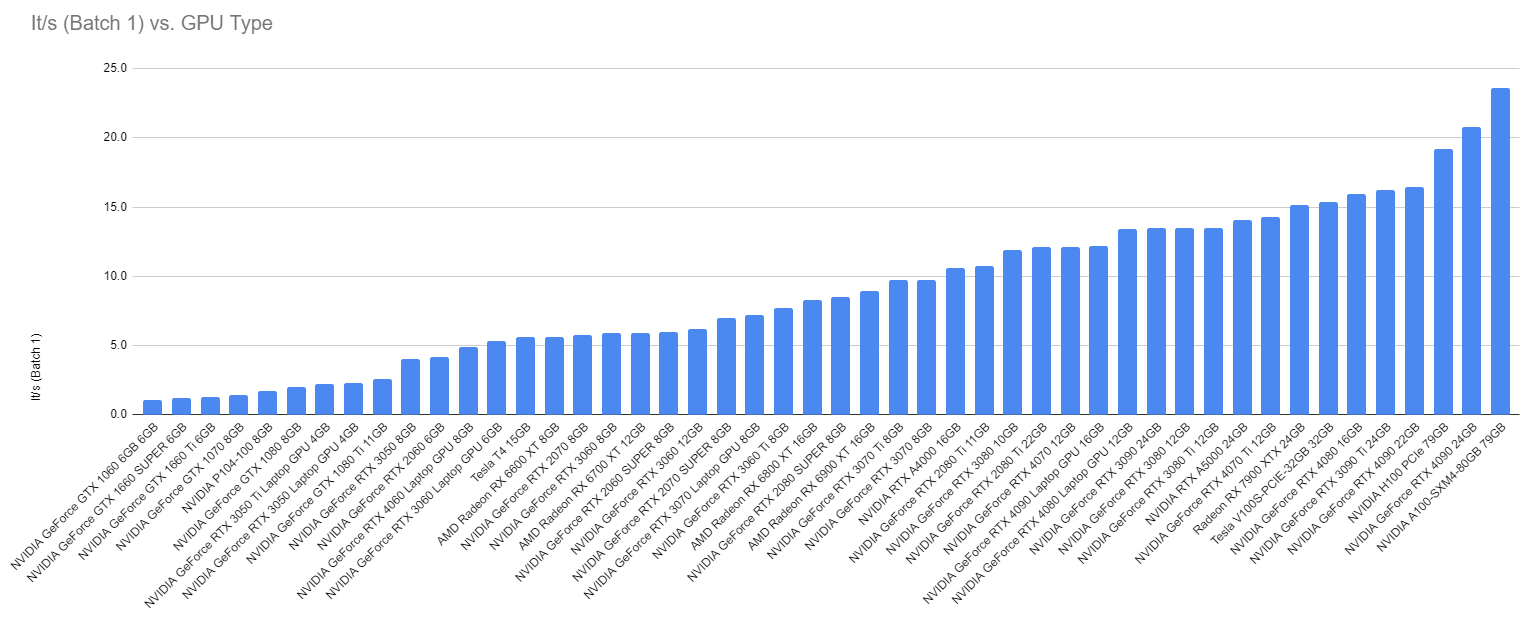
As far as I can tell based on the numbers (and me having both a 3060 and an M2 Mac) the base M2, thanks to the ML cores, sits between 1080 and 1080ti levels of performance.
Here is the data in text form (someone let me know if they've got a good idea for a less... oof.... way of formatting this comment haha).
GPU It/s (Median)
NVIDIA GeForce GTX 1060 6GB x1.0 6GB 1.11
NVIDIA GeForce GTX 1660 SUPER x1.0 6GB 1.22
NVIDIA GeForce GTX 1660 Ti x1.0 6GB 1.265
NVIDIA GeForce GTX 1070 x1.0 8GB 1.45
NVIDIA P104-100 x1.0 8GB 1.695
NVIDIA GeForce GTX 1080 x1.0 8GB 1.965
NVIDIA GeForce RTX 3050 Ti Laptop GPU x1.0 4GB 2.235
NVIDIA GeForce RTX 3050 Laptop GPU x1.0 4GB 2.3
NVIDIA GeForce GTX 1080 Ti x1.0 11GB 2.76
NVIDIA GeForce RTX 3050 x1.0 8GB 4.05
NVIDIA GeForce RTX 2060 x1.0 6GB 4.155
NVIDIA GeForce RTX 4060 Laptop GPU x1.0 8GB 4.88
NVIDIA GeForce RTX 3060 Laptop GPU x1.0 6GB 5.345
Tesla T4 x1.0 15GB 5.54
AMD Radeon RX 6600 XT x1.0 8GB 5.64
NVIDIA GeForce RTX 2070 x1.0 8GB 5.755
AMD Radeon RX 6700 XT x1.0 12GB 5.925
NVIDIA GeForce RTX 2060 SUPER x1.0 8GB 6
NVIDIA GeForce RTX 2070 SUPER x1.0 8GB 6
NVIDIA GeForce RTX 3060 x1.0 12GB 6.18
NVIDIA GeForce RTX 3070 Laptop GPU x1.0 8GB 6.87
NVIDIA GeForce RTX 3060 Ti x1.0 8GB 7.65
AMD Radeon RX 6800 XT x1.0 16GB 8.255
NVIDIA GeForce RTX 2080 SUPER x1.0 8GB 8.53
AMD Radeon RX 6900 XT x1.0 16GB 8.91
NVIDIA GeForce RTX 3070 Ti x1.0 8GB 9.725
NVIDIA GeForce RTX 3070 x1.0 8GB 9.74
NVIDIA GeForce RTX 4090 x3.0 24GB 10.465
NVIDIA RTX A4000 x1.0 16GB 10.63
NVIDIA GeForce RTX 2080 Ti x1.0 11GB 10.74
NVIDIA GeForce RTX 3090 x2.0 24GB 11.725
NVIDIA GeForce RTX 3080 x1.0 10GB 11.9
NVIDIA GeForce RTX 4070 x1.0 12GB 12.03
NVIDIA GeForce RTX 2080 Ti x1.0 22GB 12.08
NVIDIA GeForce RTX 4090 Laptop GPU x1.0 16GB 12.2
NVIDIA GeForce RTX 3080 Ti x1.0 12GB 13.38
NVIDIA GeForce RTX 3080 x1.0 12GB 13.4
NVIDIA GeForce RTX 3090 x1.0 24GB 13.565
NVIDIA RTX A5000 x1.0 24GB 14.065
NVIDIA GeForce RTX 4070 Ti x1.0 12GB 14.335
Radeon RX 7900 XTX x1.0 24GB 15.18
Tesla V100S-PCIE-32GB x1.0 32GB 15.37
NVIDIA GeForce RTX 4080 x1.0 16GB 15.74
NVIDIA GeForce RTX 3090 Ti x1.0 24GB 16.25
NVIDIA GeForce RTX 4090 x1.0 22GB 16.495
NVIDIA H100 PCIe x1.0 79GB 19.21
NVIDIA GeForce RTX 4090 x1.0 24GB 20.89
NVIDIA GeForce RTX 4090 x2.0 24GB 22.31
NVIDIA A100-SXM4-80GB x1.0 79GB 23.59
Nice. Where does the rtx a2000 12gb fall here?
Because the data was pretty noisy, I filtered out everything with <10 benchmarks. I manually checked the source (listed in the header post) and it looks like there are 2 benches for that card, and they yielded 4.93it/s and 6.38it/s.
That kind of variability is why I constrained it to 10+ measurements and took the median to exclude outliers.
What's going on from 3080 12 Gb and 24 I've the 12 Gb and I'm very confused rn
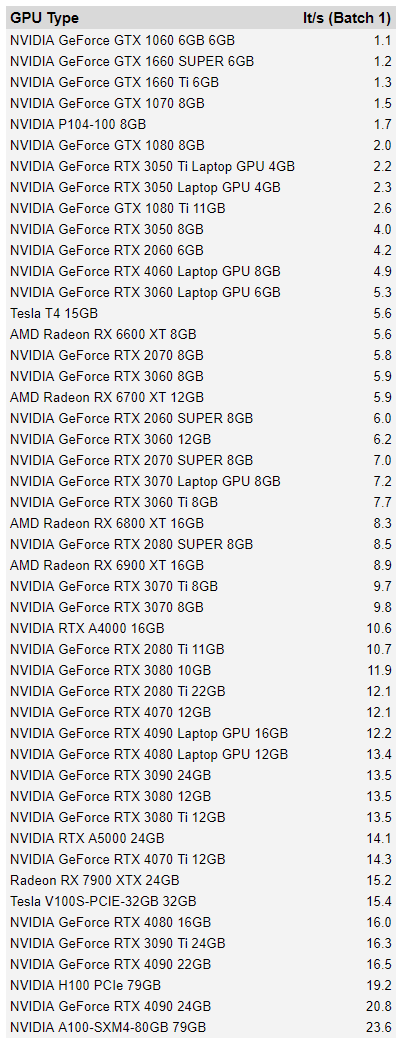
Oh, I just realized I posted a version where I hadn't filtered out dual GPU setups. There's some weird data in there.... that's a dual GPU one. Here's the actual single GPU only (the "x2" was for dual GPU stuff in the original post).

Much thanks, still a little confusing if you ask me. I thought it would have exponential increase proportional to the Vram.

