Data Is Not Beautiful
Where charts, graphs, and infographics go wrong.
Hey there, fellow data enthusiasts! We're thrilled to have you join us in this corner of the internet dedicated to dissecting and discussing some of the most cringe-worthy, misleading, and downright baffling data visualizations out there.
Here at DataIsNotBeautiful, we aim to shed light on the flaws and misinterpretations that often plague data representations. Whether it's an overcomplicated chart, cherry-picked data points, or a questionable choice of visual elements
Community Guidelines:
🤝 Be Respectful
⚖️ Stay on Topic: Keep discussions focused on data visualization and related topics.
🚫 No Personal Attacks or Witch-Hunting: Avoid personal attacks, harassment, or targeted negativity towards individuals or groups. We're here to discuss the visualizations, not the people behind them.
📢 Provide Context: When sharing bad data visualizations, try to provide context or explanations for why they are problematic. This will help foster meaningful discussions and learning opportunities.
🚀 Avoid Low-Effort Content: Do not post OC visualization that were purposfuly created to be posted in this community.
Get your pie charts here and keep your axes unlabeled!
view the rest of the comments

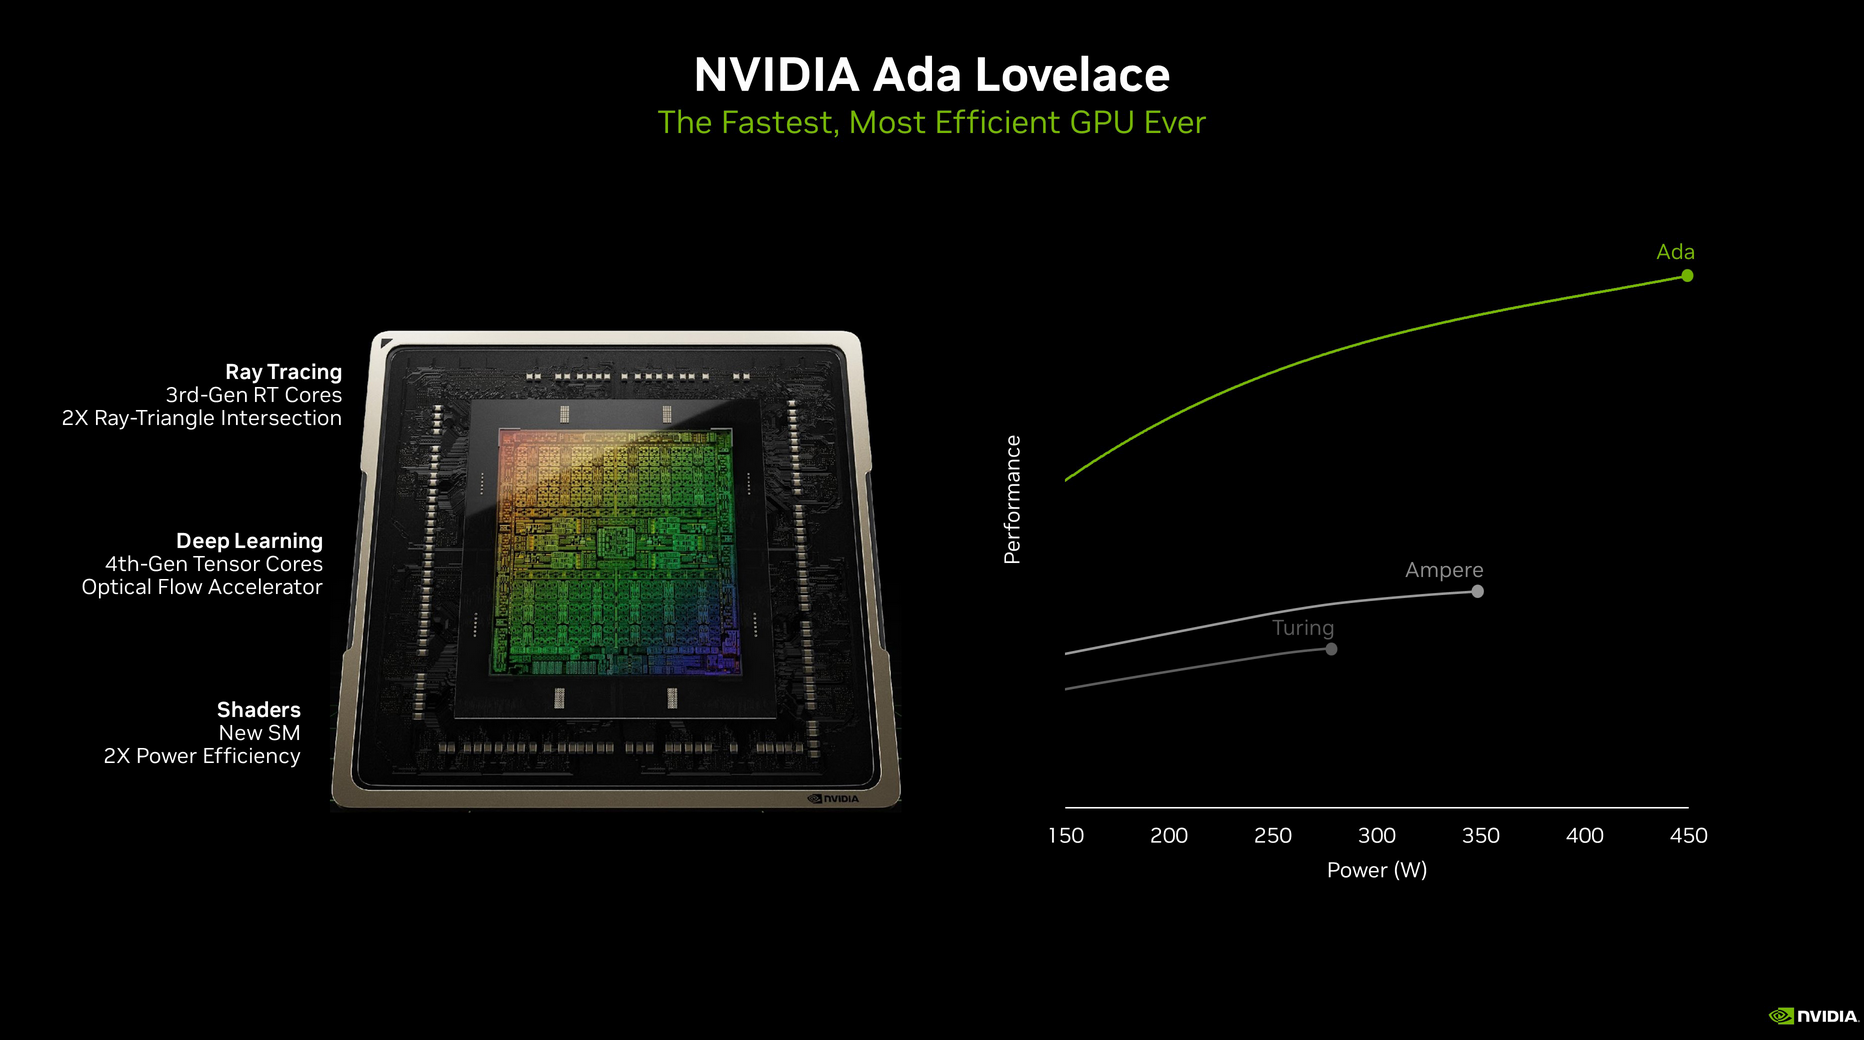
Isn’t the 40XX series such big power hogs that they developed a new connector that has a tendency to set fire to the computer?