Excel

179 readers
1 users here now

A community dedicated to any discussion about Excel. QnA, Discussion of other spreadsheet applications and ancillary programming/scripting are also welcome.

founded 1 year ago
MODERATORS
1


Does the description I wrote below describe a correct use of Excel's binomial functions?

cross-posted from: https://lemmy.crimedad.work/post/149658

Not completely sure I'm doing it right, but a 2:1 safe state for swing state swap seems like a bad deal. Here's my reasoning:

  • In New Jersey, as an example of a safe state for Harris, Fivethirtyeight has Harris winning in 993 out of 1000 simulated elections. Assuming the same turnout as 2020 of 4,549,457 votes, there's a 0.500546 chance, on average, that a NJ voter will vote for Harris. I figured that out using the BINOM.DIST.RANGE function and the Goal Seek tool in Excel.
  • In Michigan, with a turnout of 5,539,302 voters in 2020, Harris wins in only 605 out of 1000 simulations. Using the same tools above, if you randomly picked any Michigan voter, there's a 0.500059 chance that he or she is voting for Harris.
  • Using the BINOMDIST function with the assumed turnouts and the chances we determined that voters in each of the above states would go for Harris, there's a 3.25986e-4 chance that Michigan is decided by a single vote. Likewise, there's a 2.47681e-5 chance for the same in NJ. Based on the probability that it could shift electoral college votes, a Michigan ballot is distinctly more powerful than an NJ one.
  • If you could could reliably convince one more person to vote like you in NJ, your chances of affecting the NJ outcome only increase to 2.48222e-5.
  • For an NJ voter to match their chances of affecting the Michigan outcome, they would have to command about 1,925 votes besides their own. In other words, there's an almost equal chance of a single vote Harris victory in MI as a 1,926 vote victory in NJ.
  • Therefore, if a Michigan voter values their power, they should not trade their vote for anything less than 1,926 New Jersey votes. The rate should actually be greater to account for welching and Michigan having one more electoral vote than NJ.

Am I missing something?

cross-posted from: https://lemmy.ml/post/22156613

cross-posted from: https://lemmy.ml/post/22156612

Matt Sledge
November 4 2024, 1:56 p.m.#

2
3
Office LTSC 2024 is now available (techcommunity.microsoft.com)
submitted 1 month ago by Baffling7900 to c/excel


General availability to all customers to begin October, 2024

3
15
submitted 3 months ago* (last edited 3 months ago) by [email protected] to c/excel


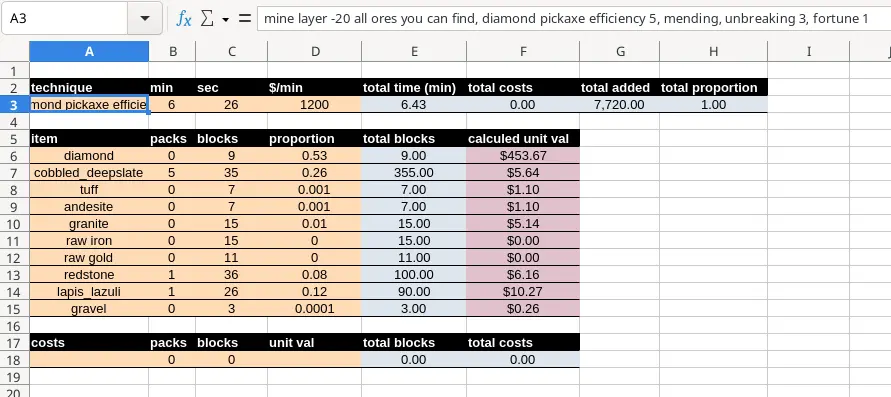
I made this spreadsheet to calculate minecraft item prices based on the time it takes to produce them but im having trouble to select the proportion of each item to divide the time (and value) between them, i need to be sure that each item is at least the average price for that item in the market. if they cant it means i dont produce with an average technique.

4
 
 
5
3
What's New in Excel (April 2024) (techcommunity.microsoft.com)
submitted 6 months ago by [email protected] to c/excel


IMHO same as previous month. Not much. Some usual improvements to web version, some new copilot AI.

For the latter in some way it's cool for non advanced users but in others what would be their ability to check for complex formulas if there is no shortcomings in what copilot proposed or what they asked.

Summary from article :

Generating multiple formula columns, creating complex formula columns that span across multiple tables, and new ways to engage with Copilot in Excel are now available to Excel users on web and Windows. Copying and pasting improvements and sharing links to sheet views are also available in Excel for the web, and the ink to text pen is rolling out to Insiders running Excel for Windows.

6
 
 
7
 
 
8
13
[News] Python in Excel (techcommunity.microsoft.com)
submitted 1 year ago by Baffling7900 to c/excel


Microsoft is introducing Python in Excel as a Public Preview for Microsoft 365 Insiders in the Beta channel.

9
5
submitted 1 year ago* (last edited 1 year ago) by Art3sian to c/excel


I’ve been making charts forever and whenever the data is negative, I move the x-axis labels to bottom-centre to get them out of the way of the bars. Suddenly, this isn’t working anymore.

I choose ‘bottom-centre’ or ‘middle’ and they just don’t move.

Any suggestions?

Attached is a Google pic of what it should be doing. Note the x-axis labels are at the bottom (A, B, C, D etc). I can’t move mine at all.

No, the options to move the labels aren’t greyed out. They’re selectable, they just do nothing.

EDIT: Fixed. It’s been moved to Labels > Labels Position. There must have been an update.

10


Immediately humbled by gigachad index match

11


Had to vent somewhere; spent a few week on and off developing a compensation system in Excel and PowerBI for a company with several divisions. Pretty simple stuff; they just wanted to benchmark and log compensations across different geographies.

In order to populate some dropdowns I used the functions SORT, UNIQUE and FILTER for the first time. Was told all clients use Excel 2019 whereas I have a office 365 subscription. Well it turns out these functions are not available in excel 2019 home and business; only in the Office 365 version. (Even though I checked the version numbers of excel and we were all using the same).

What kind of money grabbing scheme is this.... Was a simple workaround by creating the same functionality with a few lines of VBA but even so.....